Modern applications are increasingly distributed, dynamic, and complex. This makes observability essential for ensuring performance, reliability, and fast troubleshooting. But with so many tools and standards in the mix, it’s easy to get confused, especially when names like OpenTelemetry, OpenTracing, and OpenMetrics come up.
Each of these open standards plays a different role in how telemetry data is collected and analyzed. In this guide, we’ll break down how they work, how they compare, and when to use each, so you can make confident decisions about your observability stack.
Why These Frameworks Matter in Observability
Observability is the ability to understand what’s happening inside a system based on the data it produces. In modern, cloud-native environments, that data usually comes in three forms: traces, metrics, and logs. Together, these signals give engineers the visibility they need to detect issues, analyze performance, and improve reliability.
But collecting and interpreting that telemetry data isn’t always simple. Without a shared observability framework, teams often struggle with fragmented tools, inconsistent formats, and vendor lock-in. This leads to silos that slow down troubleshooting and make scaling more difficult.
To solve this, the open-source community introduced standards that unify how telemetry data is collected and exported. Three major frameworks emerged:
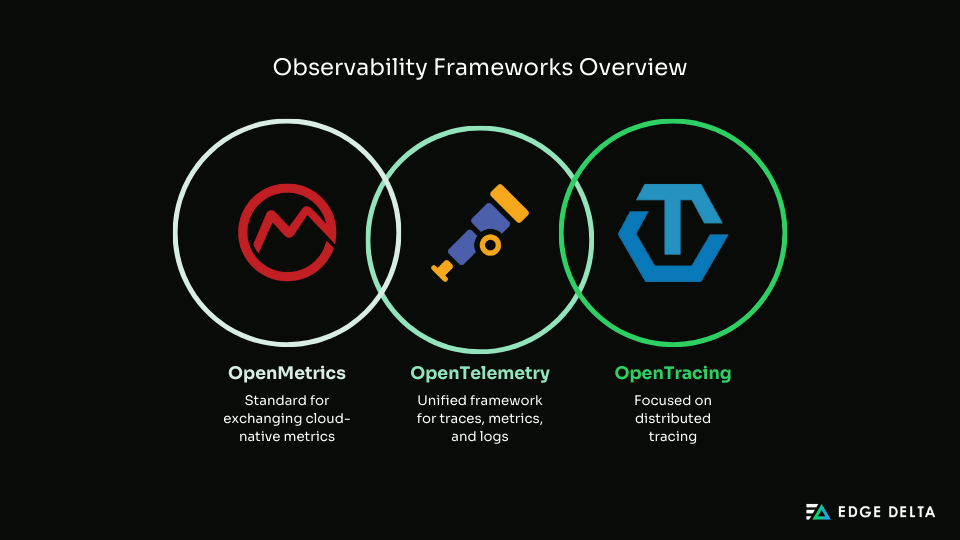
- OpenTelemetry: the unified observability framework for traces, metrics, and logs
- OpenTracing: focused solely on distributed tracing
- OpenMetrics: a standard for exchanging cloud-native metrics
Each came with a specific goal, but as systems evolved, so did the need for integration and consolidation.
Let’s begin by understanding what each framework or standard is, starting with the most widely adopted: OpenTelemetry.
What Is OpenTelemetry? (And Why It’s the Future)
OpenTelemetry is an open-source observability framework that gives you a unified way to collect, process, and export telemetry data. It covers all three pillars of observability, traces, metrics, and logs, making it a comprehensive standard for understanding what’s happening inside distributed systems.
Backed by the Cloud Native Computing Foundation (CNCF), OpenTelemetry has quickly become one of the most widely adopted projects in modern observability. It’s actively developed and supported by major cloud providers and vendors like Google, Amazon, Microsoft, and Splunk.
OpenTelemetry came to life by merging two earlier efforts: OpenTracing, which focused on distributed tracing, and OpenCensus, which handled metrics and tracing with built-in exporters. This consolidation created a single framework with consistent APIs, better tooling, and broader community support.
Key features of OpenTelemetry include:
- A unified API and SDK that simplifies how telemetry data is instrumented
- Options for both automatic and manual instrumentation
- Support for multiple programming languages like Java, Go, Python, and JavaScript
The framework is also highly extensible. It integrates smoothly with observability backends such as Prometheus for metrics, Jaeger and Zipkin for tracing, and popular platforms like Grafana, Datadog, and Elastic for visualization and analysis.
By offering a single standard that works across services and vendors, OpenTelemetry is setting the stage for the future of observability.
To fully appreciate why OpenTelemetry has become the default, it helps to know where it came from, which brings us to OpenTracing.
What Is OpenTracing? (And Why It’s Being Replaced)
OpenTracing is a now-deprecated open-source standard that was created to provide a consistent API for distributed tracing across applications. Its main goal was to make it easier for developers to instrument their code in a vendor-neutral way, without having to lock into a specific backend.
When it launched, OpenTracing helped lay the groundwork for modern observability by simplifying how traces could be collected and sent to platforms like Jaeger, LightStep, and Zipkin. It allowed different tracing tools to work with a shared API, which was a big step forward for standardization at the time.
However, OpenTracing had a narrow focus. It handled only tracing, not metrics or logs, which eventually led to the development of more unified solutions. As the ecosystem evolved, OpenTracing merged with another project, OpenCensus, to form OpenTelemetry. This newer framework provides a broader, more powerful approach to collecting telemetry data across all three signals.
That said, you might still encounter OpenTracing in older systems or legacy codebases that haven’t migrated yet. While it’s no longer actively developed, its influence lives on in the foundation of OpenTelemetry.
While OpenTracing zeroes in on traces, OpenMetrics focuses on a different observability signal entirely: metrics.
What Is OpenMetrics? (The Metrics-Focused Standard)
OpenMetrics is an open standard designed to define how metric data is exposed and transmitted, especially in cloud-native environments. It focuses solely on metrics, providing a consistent format for collecting and sharing time-series data across different monitoring tools and systems.
The project was born out of the Prometheus ecosystem, using its exposition format as a foundation. As Prometheus gained popularity for monitoring containerized and microservices-based architectures, the need for a more formalized and interoperable standard became clear. That’s where OpenMetrics came in, giving other systems a way to speak the same language.
Here’s what sets OpenMetrics apart:
- Built on the Prometheus exposition format
- Designed specifically for metrics, not logs or traces
- Helps standardize metric transport and formatting
- Widely adopted in Prometheus-compatible tools like Thanos and Grafana
- Serves as a data schema, not a full observability framework
Importantly, OpenMetrics does not handle tracing or logs. It was never designed to replace full observability solutions like OpenTelemetry, but rather to complement them by offering a common ground for metric data.
Now that we’ve looked at each individually, let’s compare how they stack up when it comes to real-world use.
OpenTelemetry vs OpenTracing vs OpenMetrics: Head-to-Head Comparison
To understand how these observability standards compare in practice, it helps to look at them side by side. Below is a quick summary of their key characteristics:
| Feature | OpenTelemetry | OpenTracing | OpenMetrics |
|---|---|---|---|
| Scope | Traces, Metrics, Logs | Traces only | Metrics only |
| Current Status | Active and expanding | Deprecated (merged into OpenTelemetry) | Active, focused on Prometheus compatibility |
| Use Case Fit | Full observability across modern systems | Legacy systems with custom tracing setups | Prometheus-based monitoring environments |
| Community Support | Strong CNCF + wide vendor adoption | Limited (legacy projects only) | Active CNCF project with Prometheus backing |
| Tooling Compatibility | Integrates with Prometheus, Jaeger, Datadog, and more | Supported by Jaeger, Zipkin, LightStep | Used by Prometheus, Thanos, Grafana |
| Instrumentation Style | Unified APIs for auto/manual instrumentation | Manual instrumentation via SDKs | Metrics exposed viaa text-based HTTP endpoint |
Why OpenTelemetry Is the Default
OpenTelemetry brings everything together. It combines what OpenTracing and OpenCensus set out to do, but in one complete framework that supports traces, metrics, and logs. That makes it a solid choice for teams that want to simplify and standardize how they handle observability.
With strong community backing and support from major players in the industry, it’s quickly becoming the go-to option for cloud-native applications.
When to Use OpenTracing or OpenMetrics
You might still encounter OpenTracing in legacy systems, especially where custom tracing is already in place and migration hasn’t yet happened. While it’s deprecated, some tools and environments continue to support it.
OpenMetrics remains relevant if you’re working in a Prometheus-first monitoring setup. It’s not meant to replace OpenTelemetry but works well alongside it, especially if you’re using Prometheus exporters to feed data into a broader observability pipeline.
Interoperability Between Standards
OpenTelemetry and OpenMetrics can complement each other. For example, OpenTelemetry can export metrics in OpenMetrics format to Prometheus, creating a bridge between modern and established tooling. Similarly, OpenTracing concepts still influence tracing integrations in tools like Jaeger, even if the newer API is OpenTelemetry-based.
Still wondering which one’s right for your stack? Let’s break down when to use each based on your environment.
When Should You Use Each? (Choosing the Right Tool)
Choosing the right observability tool depends on your current environment, infrastructure, and goals. While OpenTelemetry is quickly becoming the standard, there are still valid reasons to consider OpenTracing or OpenMetrics in specific scenarios.
Here are three use-case-driven examples to help guide your decision:
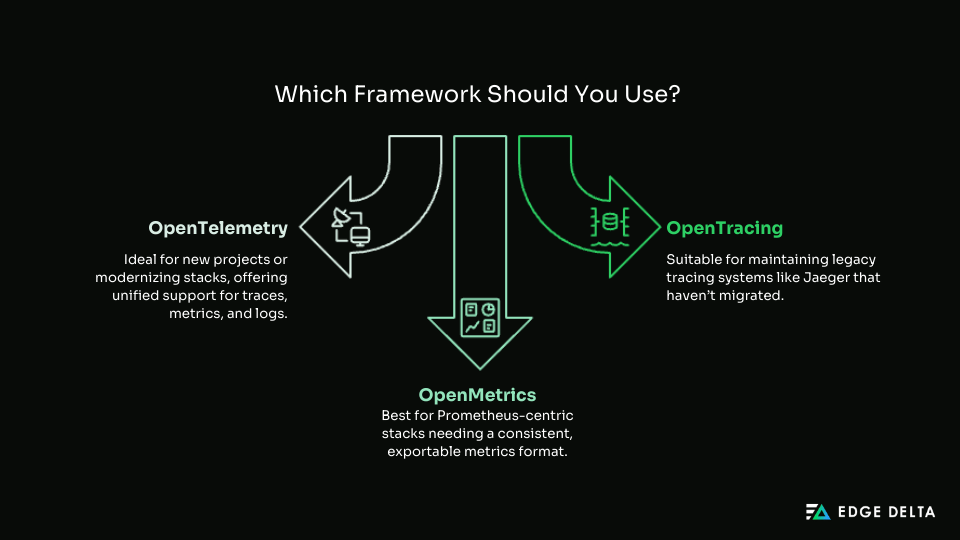
Starting from scratch? Go with OpenTelemetry.
If you’re building a new microservices-based system or migrating to the cloud, OpenTelemetry is your best bet. It supports traces, metrics, and logs out of the box and integrates with most modern observability tools.
Dealing with legacy tracing systems like Jaeger?
You may still encounter OpenTracing if your application was instrumented before OpenTelemetry gained traction. In these cases, OpenTracing can continue to work, though it’s a good idea to plan for a future migration to OpenTelemetry.
Running a Prometheus-heavy stack? Stick with OpenMetrics.
If your environment relies heavily on Prometheus for metrics collection, OpenMetrics remains relevant. It ensures your metrics stay in a consistent, exportable format compatible with Prometheus-based tools like Grafana and Thanos.
You can also use this quick checklist:
- Need full observability with strong vendor support? → OpenTelemetry
- Maintaining older tracing tools and SDKs? → OpenTracing
- Focused only on metrics, especially with Prometheus? → OpenMetrics
The Future of Observability: Why OpenTelemetry Leads
Observability is heading in a clear direction, and OpenTelemetry is leading the way. What started as a simple effort to improve tracing has grown into a powerful framework that brings together traces, metrics, and logs in one unified approach.
OpenTelemetry continues to gain momentum. Backed by the Cloud Native Computing Foundation (CNCF), it’s supported by major contributors and widely adopted by platforms like Prometheus, Jaeger, Grafana, Datadog, Elastic, and New Relic. Many of these tools now offer native support or exporters, making it easier to plug OpenTelemetry into real-world systems.
This shift toward OpenTelemetry is not just about following a trend. It shows that teams want a simpler way to instrument their applications, collect reliable data, and connect everything in one place.
As more organizations adopt cloud-native practices, OpenTelemetry is well-positioned to become the standard for observability in modern software systems.
Conclusion: A Unified Path to Better Observability
As observability tools continue to evolve, OpenTelemetry has become the standard that many teams are turning to. It combines traces, metrics, and logs into one streamlined system, making it much more flexible than the tools that came before it.
OpenTracing played a key role in shaping how we approach distributed tracing, but it is now considered a legacy solution. OpenMetrics is still useful, especially in Prometheus-based setups, but it focuses only on metrics and does not provide the full picture many teams need today.
Ultimately, choosing the right observability tools depends on your current environment. But when possible, moving toward a unified framework like OpenTelemetry can reduce complexity, improve visibility, and future-proof your stack.
Ready to simplify your observability? Use Edge Delta to accelerate your OpenTelemetry adoption.
FAQs
What’s the main difference between OpenTelemetry and OpenTracing?
OpenTelemetry is a full observability framework that supports traces, metrics, and logs, while OpenTracing focuses only on distributed tracing and is now deprecated.
Can I use OpenMetrics and OpenTelemetry together?
Yes. OpenTelemetry can export metrics in OpenMetrics format, making it compatible with Prometheus-based tools like Grafana and Thanos.
Is OpenTelemetry ready for production use?
Yes. OpenTelemetry is actively developed, widely supported by vendors, and already used in production by many teams across cloud-native environments.