

As serverless computing gains traction among businesses due to its scalability and affordability, robust observability is becoming more crucial. Serverless computing simplifies backend services, allowing IT teams to write and run code without worrying about server management. This key feature results in improved agility and lower overhead costs, but can obscure environments and make troubleshooting challenging when incidents occur.
Serverless observability is emerging as the solution. While serverless computing concentrates on the execution of applications, serverless observability focuses on the monitoring and managing them. It is crucial for any team or organization looking to integrate serverless into their tech stack, to ensure everything remains running smoothly.
This serverless observability guide explores its definition, the essential tools, the challenges it poses, and the best practices to overcome them.
Key Takeaways- Serverless observability involves monitoring, analyzing, and assessing serverless processes and events to gain full visibility and actionable insights.
- The reliability, security, and performance of serverless applications are aided with serverless observability.
- Traditional observability techniques face major challenges due to the ephemeral nature of serverless services and the absence of persistent infrastructure.
- Observability tools such as AWS X-Ray, Datadog, New Relic, Edge Delta, Azure Monitor, and Google Cloud Operations Suite cater to the unique demands of the serverless environment.
- Best practices for serverless observability include centralized logging, real-time monitoring, distributed tracing, and automatic anomaly detection and alerting.
What is Serverless Observability?
Serverless observability is the practice of monitoring, tracking, and evaluating serverless applications’ behaviors and performance. It aims to provide a full understanding of the serverless environment to ensure optimal performance, reliability, and security.
Maintaining the functionality and health of serverless apps requires serverless observability. Through its extensive monitoring and analysis of serverless functions, events, and infrastructure, it offers actionable insights and full visibility. As a result, it enables organizations to proactively optimize and manage their serverless environments.
Key Components of Serverless Observability
Metrics, logs, and traces work together to provide a comprehensive overview of the reliability, security, and performance of serverless applications. Using these components, entities can get a profound understanding of their serverless environments, permitting proactive management, issue resolution, and continuous enhancement.
Here is a brief description of each of the core components of serverless observability:
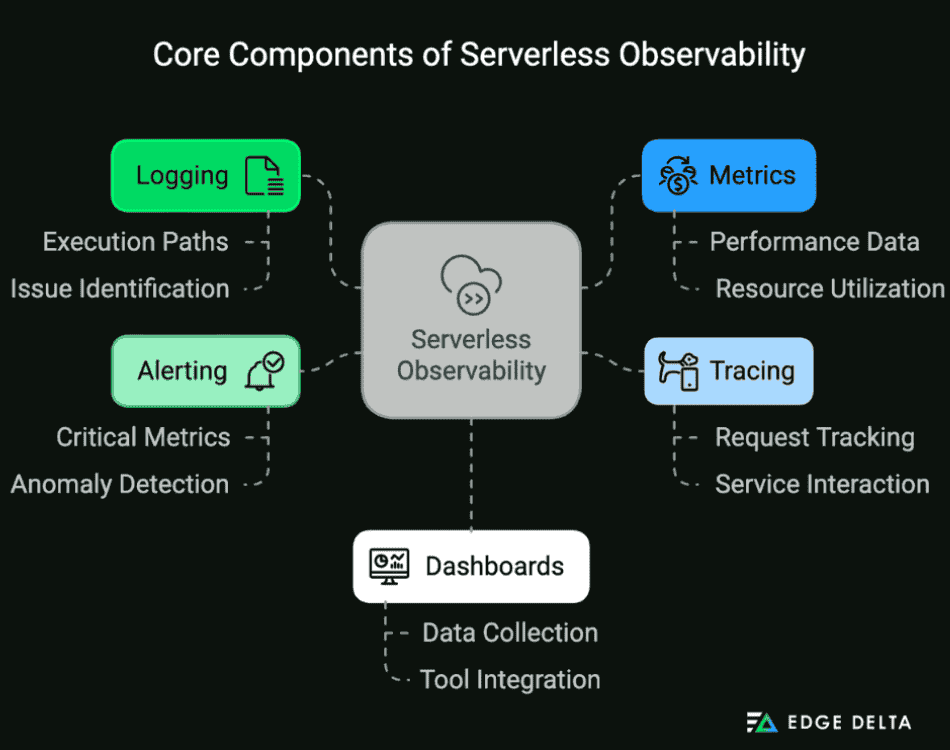
- Logging: Collect and analyze in-depth serverless function logs to track the path of execution, identify problems, and monitor activities.
- Metrics: Record performance, resource utilization, and error rate data in real-time, and visualize them using dashboards.
- Tracing: Utilize distributed tracing to track requests as they move through various services and functions to obtain a complete picture of how the application behaves.
- Alerting: Set up alerts for crucial metrics and anomalies, enabling proactive issue resolution and minimizing downtime.
- Dashboards: Employ centralized dashboards to collect and show data using various observability tools to acquire a holistic view of the serverless environment.
Serverless Observability vs. Traditional Observability
Serverless and traditional observability differ significantly in their approaches to monitoring, scalability, and data gathering. Traditional observability focuses more on maintaining the health and functionality of long-lasting, static systems. Serverless observability requires tools that can handle the dynamic and ephemeral nature of serverless services for accurate, real-time insights.
The table below shows the distinctions between serverless and traditional observability.
| TRADITIONAL OBSERVABILITY vs. SERVERLESS OBSERVABILITY | ||
|---|---|---|
| Aspect | Traditional Observability | Serverless Observability |
| Scope | Focuses on specific layers of the application stack. | Provides a holistic view of serverless functions and events. |
| Data Sources | Collects logs, metrics, and traces from long-lived processes. | Collects logs, metrics, and traces, particularly in the context of even-driven architectures. |
| Scalability | Requires manual scaling of observability tools. | Uses auto-scaling capabilities built into serverless systems. |
| Resource Management | Monitors and manages resources at the server level. | It focuses on specific function executions. |
| Insight Level | Provides isolated insights into specific layers. | Offers integrated, holistic insights. |
| Monitoring Focus | Primarily targets long-lived processes and services. | Concentrates on short-lived event-driven functions. |
| Cost Consideration | Based on fixed resource allocation, resulting in increased expenses. | Operates on a pay-per-use model, potentially leading to cost savings. |
Challenges in Serverless Observability
Serverless observability poses unique challenges due to serverless’ highly scalable, dynamic, and event-driven nature. Here are some of the key challenges associated with serverless observability:
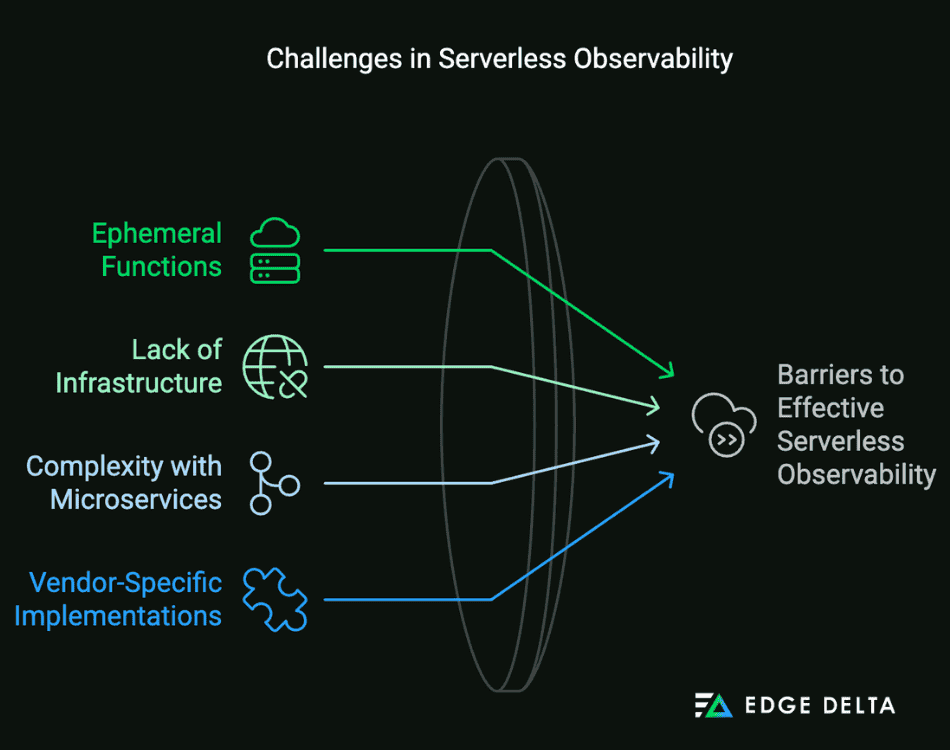
Ephemeral Nature of Serverless Functions
Serverless operations’ stateless and short-lived nature presents significant drawbacks for monitoring and observability. Since serverless functions operate in ephemeral, fine-grained instances, it can be challenging to continuously monitor and trace their behavior.
- Challenge: Since serverless functions are ephemeral and instantiated on demand, collecting and maintaining consistent monitoring data is challenging. Constant starts and stops complicate the tracing of performance and condition.
- Solution: Collect information during the brief execution window of serverless functions by using advanced observability techniques made for dynamic contexts. Additionally, install centralized logging systems that collect metrics and logs across serverless functions and tag them with relevant contextual information.
Lack of Persistent Infrastructure
The absence of persistent infrastructure in serverless systems poses serious observability issues. In traditional systems, infrastructure and persistent servers play a major role in monitoring.
- Challenge: Since there is no persistent infrastructure in serverless architecture, there is no fixed environment to consistently monitor. The cloud provider manages resource allocation, which obscures the details of the underlying infrastructure and makes traditional monitoring methods challenging.
- Solution: Use serverless environments, integrating cloud-native monitoring solutions such as AWS CloudWatch, Azure Monitor, and Google Cloud Operations Suite, or leverage Telemetry Pipelines to send data to other downstream platforms for analysis. These tools can adjust to the ephemeral nature of serverless operations by dynamically collecting and analyzing metrics and logs.
Increased Complexity with Microservices
Serverless computing and microservices architecture significantly increase the complexity of monitoring and observability. Microservices in serverless settings are loosely coupled and individually deployable, unlike monolithic applications, whose components are closely coupled and easy to trace.
- Challenge: The microservice architecture in serverless platforms is complex due to various small, independent functions interacting independently. As a result, getting a unified view of the functionality and state of the system can be challenging.
- Solution: Use distributed tracing tools to follow requests across serverless functions and services, such as AWS X-Ray or Datadog APM. By offering end-to-end insight, these technologies help in the detection of latency issues and performance bottlenecks.
Vendor-Specific Implementations
Due to differences in tooling, APIs, and monitoring, vendor-specific implementations of serverless platforms pose distinct observability challenges. Effective serverless application monitoring, debugging, and optimization may become more difficult as a result of these variations.
- Challenge: Each cloud provider implements serverless services differently, and observability standards may not be followed consistently. Maintaining a uniform observability strategy might be challenging due to variations in how metrics, logs, and traces are managed.
- Solution: Implement adaptable observability techniques and tools that can interface with various cloud service providers. Multi-cloud compatibility is provided by tools like Datadog and New Relic, which may help in standardizing observability protocols between various serverless platforms.
The following section will discuss the top five tools for serverless observability.
5 Best Tools for Serverless Observability
Through centralized logging and real-time analytics, these serverless observability tools ensure thorough visibility and efficient serverless system management. The organization’s specific needs and requirements play a major role in selecting the best tool to use.
Below is a table comparison highlighting the features of the top serverless observability tools.
| SERVERLESS OBSERVABILITY TOOLS | |||||
|---|---|---|---|---|---|
| Feature | AWS X-Ray | Datadog | New Relic | Azure Monitoring | Google Cloud Operations Suite |
| Function Monitoring | Yes | Yes | Yes | Yes | Yes |
| Event Tracking | Yes | Yes | Yes | Yes | Yes |
| Real-Time Analytics | Yes | Yes | Yes | Yes | Yes |
| Integration with Cloud Providers | AWS, Azure | AWS | AWS, Azure, GCP | Azure | GCP |
| Alerting Mechanism | SMS | SMS |
Here are five of the best serverless observability tools’ key features and benefits:
1. AWS X-Ray: Best for Extensive Integration with AWS Services
AWS X-Ray helps organizations by providing a comprehensive overview of the entire request flow in serverless applications. It helps identify latency issues and performance bottlenecks by tracking requests via AWS services.
Features:
- Request and response tracking
- Performance insights
- Service mapping
Benefits:
- Comprehensive service maps for visualizing dependencies
- Real-time tracing and analysis
- Deep connectivity with AWS services
- Provides distributed tracing for AWS Lambda functions and other AWS services
2. Datadog: Best for Multi-Cloud Support and Thorough Observability
Datadog provides real-time monitoring of metrics, logs, and traces for enhanced serverless observability. The tool’s Application Performance Monitoring (APM) with distributed tracing provides thorough insights into request flows across serverless functions and other services.
Features:
- Log aggregation
- Customized dashboards
- APM with distributed tracing, alerting
- Anomaly detection
- Real-time monitoring of serverless operations
Benefits:
- Support for several clouds
- Extensive observability across metrics, logs, and traces
- Scalable architecture that is appropriate for large-scale settings
3. New Relic: Best for Supporting Hybrid Environments
New Relic provides IT teams with end-to-end visibility into the performance of serverless applications through real-time analytics, distributed tracing, and log collection. It ensures application reliability by helping in the detection and resolution of performance issues.
Features:
- Distributed tracing, alerting, and reporting
- Real-time analytics
- Infrastructure monitoring
- End-to-end insight into serverless application performance.
Benefits:
- Proactive anomaly detection
- In-depth insights into application performance
- Support for hybrid settings
4. Azure Watch: Best for Native Integration with Microsoft Azure Services
Azure Monitoring enables seamless integration with Azure Functions, providing robust monitoring and diagnostic capabilities. It facilitates distributed tracing and collects and analyzes metrics and logs while offering thorough application insights.
Features:
- Distributed tracing, metrics, and log collecting
- Application insights, monitoring, and diagnostics for Azure Functions
- Connection with Azure services
Benefits:
- Strong analytics and visualization capabilities
- Automatic resource scaling and management
- Native connection with Microsoft Azure services
5. Search Cloud Operations Suite: Best for Integration with Google Cloud Platform Services
Google Cloud Operations Suite, formerly Stackdriver, offers full observability for Google Cloud Functions. It helps IT teams maintain peak efficiency and reliability by monitoring, logging, tracing, and reporting errors.
Features:
- Metrics gathering, tracing, error reporting, dashboards, alarms
- Monitoring, logging, and diagnostics for Google Cloud Functions
Benefits:
- Multi-cloud compatibility
- Debugging capabilities
- Intelligent alerts
- Integration with Google Cloud Platform services
The next section will discuss the best practices for serverless observability.
Best Practices for Serverless Observability
Serverless observability’s best practices focus on the essential strategies for efficiently managing, monitoring, and optimizing serverless applications. These procedures use advanced observability tools and strategies to ensure high performance, reliability, and security in dynamic, event-driven environments.
Here are some of the best practices for serverless observability:
Data Collection Techniques
To achieve effective observability in serverless settings, it is crucial to collect logs, metrics, and traces that are unique to serverless activities. These methods enable proactive serverless application monitoring, analysis, and optimization to ensure optimal efficiency and reliability.
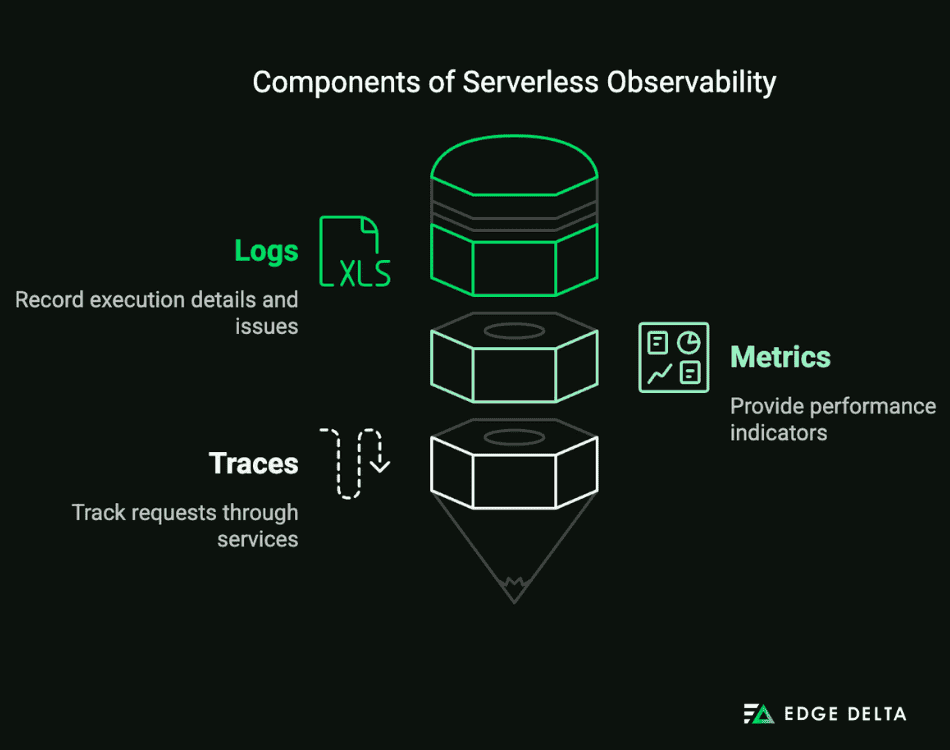
- Logs record execution details and problems
- Metrics offer performance indications like execution time and memory usage
- Traces follow requests as they pass through various services
Correlation and Contextual Analysis
Contextual analysis considers the relationships among various data points, which helps to identify dependencies and root causes. To gain a thorough understanding of system behavior, correlation, and contextual analysis of data from several sources involves connecting logs, measurements, and traces.
Visualization and Dashboards
Dashboards and other visual tools are used in visualization techniques to provide integrated views of the performance and health of the system. These tools provide insights into resource utilization and application behavior by collecting and displaying data from logs, metrics, and traces in real-time.
Automated Alerting and Incident Response
Setting up automated alerts involves defining thresholds based on metrics and logs to initiate notifications for anomalies or performance degradation. To preserve system reliability and reduce downtime, automated incident response comprises real-time notifications and automatic corrective procedures.
Regular Reviews and Updates
Regular reviews of observability procedures ensure that methods and tools continue to be useful and applicable. Adding new features, streamlining setups, and coordinating procedures with changing business and technological demands are all part of updating observability strategies.
Collaboration Across Teams
Collaboration across the development, operations, and security teams enhances observability by sharing ideas, accelerating problem-solving, and improving overall system reliability. Cross-team collaboration ensures that observability targets correspond with operational needs and business objectives.
Conclusion
Serverless observability is essential to understanding and improving the performance of serverless applications. By utilizing tools that collect and evaluate data from events, functions, and infrastructure, organizations can ensure reliability and effectiveness in their cloud-native deployments.
FAQs
What is serverless observability?
Serverless observability is the capacity to monitor, analyze, and gain insight into the behavior, health, and operation of serverless applications and services.
Is Kubernetes considered serverless?
No, Kubernetes is an open-source container orchestration platform that automates containerized application deployment, scalability, and management. However, tools like AWS Fargate allow for Kubernetes pods to run without managing EC2 instances.
What is a serverless dashboard?
A serverless dashboard is a visualization tool that offers measurements and insights into serverless services and applications.
How does observability apply to serverless?
While serverless completely abstracts away infrastructure administration, serverless observability concentrates on monitoring and understanding serverless applications to ensure they run smoothly.
Sources:

