
AWS Lambda is a serverless compute service that lets you run code without provisioning or managing servers. This service makes it effortless to run event-driven workloads without the need to manage infrastructure and worry about scalability.
AWS Lambda has a built-in integration with Amazon CloudWatch Logs that pushes all logs from your code to a CloudWatch Logs group associated with a given Lambda function. While this default logging capability is easy to use, it can quickly become expensive.
Many of our customers have mentioned the cost of monitoring event-driven data grows exponentially as they scale their adoption of serverless architectures. That’s because traditionally, they’ve been required to stream all of their raw CloudWatch Logs data directly to their centralized observability platform. Not only is it expensive to ingest this volume of raw data, but customers also have to wait for it to be centralized and indexed before being able to inspect, alert, and monitor against it. You can overcome this challenge with the Edge Delta Lambda extension.
Overview of the Edge Delta Lambda Extension
At Edge Delta, we use a unique distributed architecture instead of a traditional centralized management system. The platform uses stream processing to analyze the underlying data at the source. By deploying Edge Delta between the raw serverless observability data and your target streaming destinations, you gain automated observability, anomaly detection, and other core visibility, while also significantly reducing the volume of data required to stream to your observability platforms.
Traditionally, a distributed agent approach works well with host-specific sources, such as files, system events, or container logs. However, it’s not exactly the right fit for external push-based sources, such as Lambda function logs consumed via HTTPS. Edge Delta’s hosted agent environment solves this problem, allowing customers to realize the value of a distributed approach within their serverless architecture.
The environment consists of Edge Delta agents running on a Kubernetes cluster with the same configuration as if there were a single agent. Hosted agents provide high availability with filesystem-based buffering provided by HTTP recorders. Simultaneously, Edge Delta increases throughput by deploying multiple worker agents to process your telemetry data in parallel.
Typical problems that may arise from having multiple agents work on different parts of the telemetry data are addressed by our aggregator agent architecture. An aggregator agent is automatically deployed behind the screens when the selected worker agent count is greater than one. Knowing the presence of the aggregator agent, other agents send their part of the processed data to the aggregator instead of the actual destinations of the workflow.
Lambda Extensions Overview
Before Lambda Extensions came along, there was nowhere to install or run an observability solution in tandem with the Lambda functions on the ephemeral Lambda runtime. Instead, Lambda lifecycle events were handled in an isolated runtime environment. The introduction of the Extensions API gives observability tools greater control during three phases of the Lambda execution lifecycle: Init, Invoke, and Shutdown.
Init
As part of its initialization, an extension has to register itself with the Extensions API by calling the register endpoint. All extension Init phases start in parallel and before the actual runtime init. To complete the Init phase, all extensions and Lambda runtime must signal they are ready.
Invoke
When a Lambda function is invoked, each extension will receive an INVOKE event from the Extensions API. The function’s timeout setting limits the duration of the entire Invoke phase and ends after the runtime, and all extensions signal completion by sending a Next API request.
Shutdown
When Lambda is about to shut down the runtime, it sends a Shutdown event to each external extension. Extensions can use this time for final cleanup tasks. During the Shutdown phase, the extension has two seconds to execute any cleanup logic. If the runtime or any extension does not respond, Lambda terminates it via a signal (SIGKILL).
After completion, Lambda freezes the execution environment to speed up the next possible invocation. If the function is invoked within this period, it is thawed and resumes execution.
Lambda extensions can use the Lambda Runtime Logs API to subscribe to log streams directly from within the Lambda execution environment. Lambda streams the logs to the extension, and the extension can then process and send the logs to any preferred destination.
How Edge Delta Lambda Extension Works
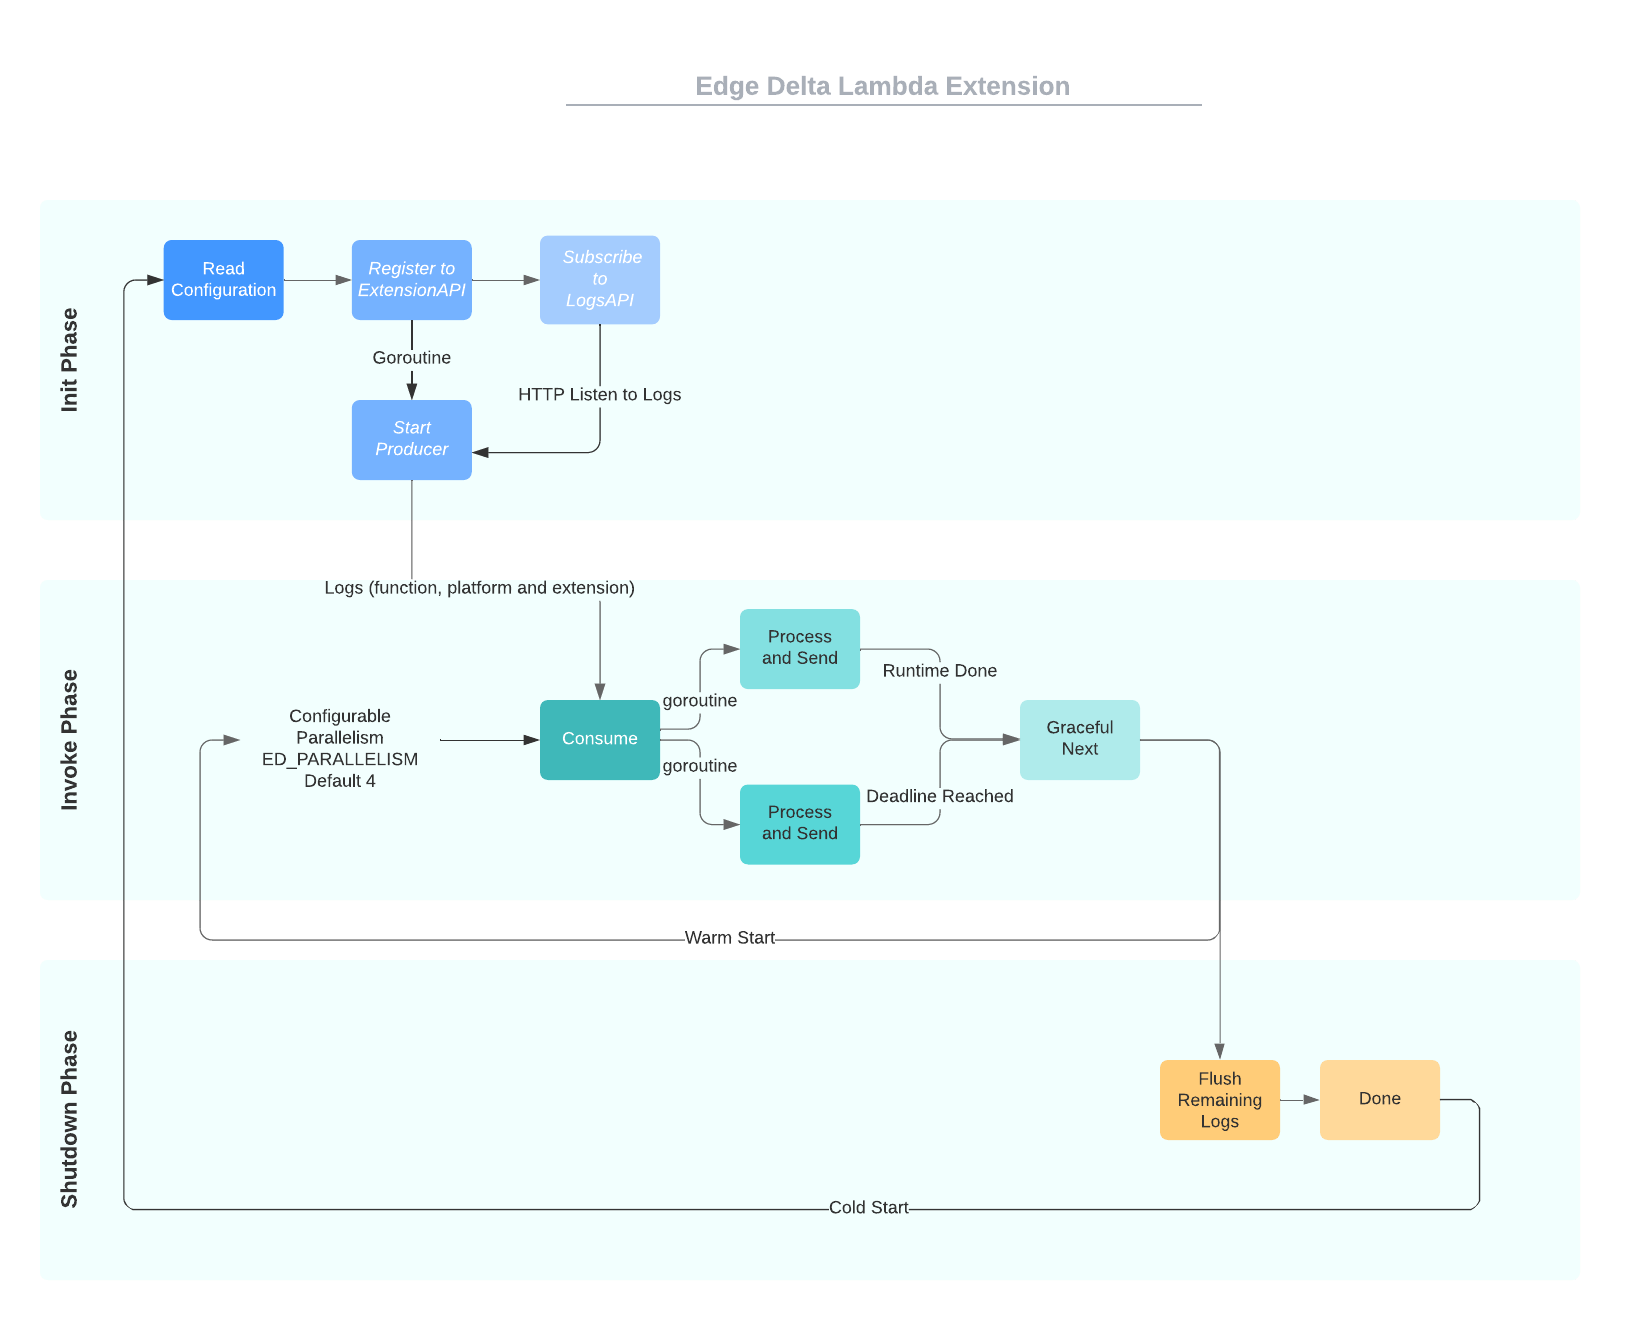
At Init phase, Edge Delta Lambda Extension registers itself to the Lambda Runtime environment and subscribes to chosen Logs API endpoints (function, platform, extension). A producer goroutine that listens to the default Lambda log endpoint is spawned. This producer goroutine runs as long as the extension is alive and puts any received logs from the Logs API into a synchronized queue. An environment variable must provide a Destination Hosted Agents endpoint.
When Invoke events are received, our Lambda extension notes the timeout value set for the Lambda function. Trying to run longer than this allocated time typically causes timeouts and unwanted function failures. Multiple pusher goroutines are spawned depending on the expected volume of your telemetry data. These pushers are very lightweight and do only rudimentary processing on the data before streaming telemetry to the hosted agents. Pushers only stop running when the deadline is reached, or a runtime done telemetry is received.
If a shutdown event is triggered by Lambda runtime or a timeout, Pushers try to flush remaining logs in the queue before terminating gracefully. Edge Delta hosted agents tails the produced log file by the HTTPS stream. A single Lambda function execution may contain multiple events such as requests, traces, or dependencies. All events are processed and filtered according to the configuration provided to the hosted agents.
This approach gives your organization the best of both worlds; you can get full visibility into important data without having to ingest the low-value raw data.
If Lambda role permissions are set to allow Cloudwatch Logs, original events that are emitted from Lambda Functions will also be sent to Cloudwatch Logs as is.
How to Use Edge Delta Lambda Extension
This section explains how to deploy the Edge Delta Lambda Extension as a layer to the intended Lambda Function and how Hosted agents are configured to listen to the telemetry data sent by the extension. To do so, carry out the following steps:
- Create a new config on app.edgedelta.com with your requirements.
- Go to the Hosted Agents menu and create a new hosted agent environment. Select agent count, memory limit, and CPU limit per your telemetry flow requirements. Wait for the deployment to get to ready state. Take note of the HTTPS Endpoint field.
There are two options for adding Edge Delta Lambda extension to your Lambda function environment.
Zip Files
If you want to build your own layer:
- Download the latest extension.zip file from the Edge Delta Extension Release Page.
- Upload this file as a layer to your AWS account.
aws lambda publish-layer-version --layer-name "<layer-name>" --region "<use your region>" --zip-file "fileb://extension.zip" - Note down .LayerVersionArn from the output of the above command, we will use it to specify which ARN we want to use while adding layers.
- In the AWS Management Console, navigate to Lambda function, Select Layers and click Add a Layer.
- Select Specify an ARN. If you uploaded your own ARN like in step 2, use .LayerVersionArn in this step. Otherwise, use:
arn:aws:lambda:<AWS_REGION>:233765244907:layer:edgedelta-extension:<LATEST_LAYER_VERSION>
Container Images
- Download the latest extension.tar.gz file from the Edge Delta Extension Release Page.
- In your container Dockerfile, add the command below.
ADD <path-to-tar.gz-file>/extension.tar.gz /opt/ - Check if edgedelta-extension is correctly extracted under the /opt/extensions directory.
docker run -it --entrypoint sh <image>:<tag> ls /opt/extensions
Set Environment Variables
The Edge Delta Lambda extension can be configured using Lambda function environment variables.
| Environment Variable Name | Description | Type |
|---|---|---|
| ED_ENDPOINT | Hosted agents https endpoint | Required |
| ED_PARALLELISM | Determines the count of streamer goroutines to consume logs. Default is 4. | Optional |
| ED_LAMBDA_LOG_TYPES | Types of logs to get from Lambda Function. Options are function, platform, extension. Default is function, platform. | Optional |
| ED_BUFFER_SIZE | Buffer size of the log queue. Default is 100. | Optional |
| ED_RETRY_TIMEOUT | Total duration to keep retry sending logs. Default is 0. Supports short time format (5s, 1m). | Optional |
| ED_RETRY_INTERVAL | Initial interval to wait until next retry. It is increased exponentially until timeout limit is reached. Default is 0. | Optional |
After all the configuration and deployment is complete, trigger the Lambda Function by simulating a failure case a few times to see if any insights, anomalies, or alerts are generated according to your config.
Conclusion
As you’ve seen in this post, Edge Delta is giving a creative new spin to a seemingly outdated centralized analysis approach. We’ve combined this dynamic approach with a lightweight and optimized Lambda extension to help you reduce observability costs within your serverless environments. At the same time, this extension helps you achieve new and improved technical capabilities with faster and more advanced insights.