

A time series metric is a measurement collected at regular intervals, representing the value of a specific variable over time. The intervals are fixed and usually measured in seconds, minutes, hours, or days.
Time series metrics provide insights into variable behavior over time, linking specific patterns to periods. They are essential for observability, offering continuous data streams that capture system performance and changes. They help engineers monitor systems, diagnose issues, and optimize performance. By leveraging time series metrics, teams can maintain efficiency and reliability under varying conditions.
Read on to learn more about time series metrics, what they are, and how they affect observability.
Key Takeaways
- Time series metrics are data points collected over discrete intervals across time.* Time series metrics capture data that is both measurable and that varies over time.* Understanding and using time series metrics helps organizations understand system performance, user behavior, and operational efficiency. * Observability relies heavily on time series metrics for real-time insights and historical data analyses.
What Are Time Series Metrics?
Time series metrics are measurements for analyzing and evaluating organized and recorded data over time. They are designed to capture and analyze patterns, trends, and behaviors that emerge in sequential data.
Typically, time series data are collected regularly (either daily or hourly). You can collect data by minute, second, or millisecond for an even more in-depth view—which is usually required for situations that need a precise understanding of the data.
Another essential aspect of time series metrics is their dual nature of being both measurable and variable. Being measurable means that the metric can be assigned a numeric value, allowing for precise quantification and analysis. Their variable nature indicates that these metrics change over time, reflecting dynamic patterns and trends in the data.
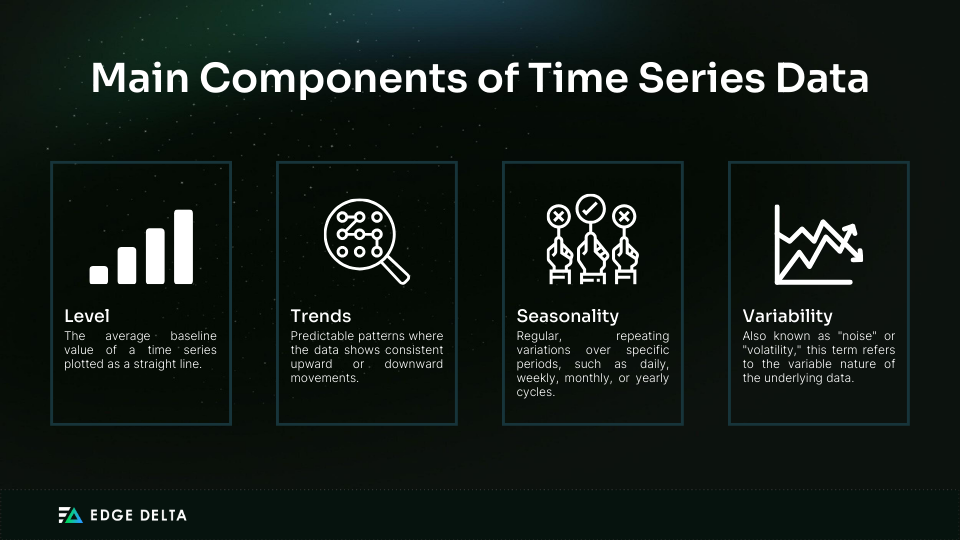
Time series data can be broken down into four main components:
Here are a few examples of time series data:
| Metric | Description |
|---|---|
| CPU Usage | Percentage of CPU capacity being used over time. |
| Memory Consumption | Amount of memory being used by applications. |
| Network Traffic | Amount of data being transmitted and received over time. |
| Application Response Times | Time taken for an application to respond to requests. |
Time-series data is utilized across various domains and industries, providing key insights into data trends over time regardless of discipline. Some typical applications include:
- Finance
Analyzing stock prices, currency exchange rates, trading volumes, economic indicators, and financial market trends. This data helps with investment decisions, risk assessments, portfolio management, and algorithmic trading.
- Internet of Things (IoT)
Monitoring sensor readings, temperature, humidity, energy consumption, and device status. Time-series analysis enables monitoring, anomaly detection, predictive maintenance, and optimization of IoT systems.
Importance of Time Series Metrics in Observability
Time series metrics are crucial for observability. They provide a continuous stream of data points that track the performance and health of systems over time. These metrics enable real-time monitoring, trend analysis, and anomaly detection, ensuring proactive issue resolution and system reliability.
1. Trend Analysis
Time series metrics are vital for observability, primarily enabling:
- Robust trend analysis that helps identify patterns
- Future behavior predictions
- Data-driven decision-making
When plotted on a timeline, time series metrics reveal recurring patterns and anomalies. For instance, CPU usage spikes may indicate an underlying issue with one or several batch-processing jobs. Sudden deviations, like increased error rates, can signal new bugs or system failures and require immediate investigation.
For example, an e-commerce platform can analyze web traffic time series data to predict peak periods during sales events. This analysis allows proactive scaling of server capacity to ensure a smooth user experience.
Similarly, a cloud service provider can track CPU and memory usage to identify high and low usage patterns. This tracking helps optimize resource allocation and reduce operational costs.
2. Anomaly Detection
Time series metrics are essential for anomaly detection, signaling potential issues like system failures, performance problems, or security breaches. By monitoring and analyzing data over time, organizations can spot unusual patterns that may indicate underlying problems.
Here’s a detailed look at the importance of time series metrics in anomaly detection:
- Pattern Recognition
Time series metrics allow for recognizing regular patterns and trends in data. Understanding what is expected over time makes spotting deviations that might indicate anomalies easier.
For example, in business monitoring, recognizing regular sales cycles helps identify unexpected drops or spikes in revenue, which could signal issues such as a system outage or a successful marketing campaign.
- Contextual Analysis
Anomalies are context-dependent. Time series analysis provides the necessary context by considering the temporal nature of the data. For instance, an increase in website traffic might be expected during a promotional period but could be an anomaly at other times, potentially indicating a cyber attack.
- Improved Accuracy
Time series metrics enhance the accuracy of anomaly detection. Leveraging historical data models can more precisely distinguish between normal fluctuations and actual anomalies. For example, a sudden spike in server CPU usage might be flagged as an anomaly if it significantly deviates from past patterns during similar times.
- Proactive Response
The ability to detect anomalies in real-time through time series metrics enables organizations to respond proactively rather than reactively. This proactive approach can keep minor issues from turning into major ones. In customer experience monitoring, for example, early detection of a drop in user engagement can prompt immediate actions to rectify the situation.
- Scalability
Time series analysis is highly scalable, making it suitable for large datasets and complex systems. As businesses grow and data volumes increase, time series methods can continue to provide valuable insights without significant degradation in performance.
3. Capacity Planning
Time series data can help network administrators predict future capacity needs. Understanding historical usage patterns and trends allows them to allocate resources efficiently and ensure optimal network performance. Time series metrics provide detailed insights into usage patterns, trends, and anomalies, which can help inform resource allocation decisions.
Statistical modeling, machine learning algorithms, and regression analysis can use past data to predict future usage. For example, if time series data shows a steady growth in user traffic, predictive models can estimate the additional resources required to maintain performance.
Here’s how time series metrics can help in capacity planning:
- Optimizing Resource Allocation
Time series metrics enable precise resource allocation by highlighting areas of overuse and underuse. Optimizing resource allocation allows administrators to do the following:
- Shift resources from underutilized areas to those experiencing high demand.
- Adjust the scale of resources (e.g., adding more servers) to match anticipated demand.
- Implement automated systems that dynamically adjust resource allocation based on real-time time series data.
- Enhancing Scalability and Flexibility
Planning for scalability is essential for accommodating growth without excessive expenditure. Time series metrics help administrators:
- Identify when and where to scale resources up or down, ensuring that the infrastructure can grow with demand.
- Introduce flexible solutions like cloud services that can be adjusted in real-time based on usage patterns.
- Continuous Monitoring and Real-time Adjustments
Regular monitoring of time series metrics allows for continuous assessment of resource usage. If the data reveals unexpected spikes or drops in usage, administrators can quickly:
- Adjust resources in real-time to address unforeseen demands
- Ensure consistent performance by proactively managing resource allocation
4. Real-Time Monitoring
Time series metrics enable real-time network performance monitoring, offering immediate insights into system performance and health. Network administrators can continuously collect and analyze data by leveraging these metrics, promptly identifying issues, and taking corrective actions to maintain optimal system functionality.
This capability underlines the importance of real-time monitoring, which includes several critical aspects:
- Instantaneous Detection of Anomalies
Time series metrics allow for the instantaneous detection of anomalies or performance degradations. This early detection is crucial in preventing issues from escalating, thereby reducing downtime and ensuring continuous service availability.
- Proactive Problem Anticipation
With real-time data provided by time series metrics, system administrators can anticipate potential problems before they impact system performance. This proactive approach ensures that systems are maintained within their optimal performance parameters.
- Comprehensive System View
Collecting and analyzing time series metrics can help organizations gain a comprehensive and dynamic view of their systems. This holistic view is necessary to assess infrastructure health and performance.
- Resource Utilization Insights
Real-time insights into resource utilization help organizations manage their infrastructure more effectively. By monitoring how resources are used, organizations can optimize performance and allocate resources where they are needed most.
- Informed Decision-making
The ability to analyze performance data in real-time supports more informed decision-making. Organizations can respond swiftly to emerging trends and potential issues, ensuring their systems remain efficient and reliable.
Time Series Metric Use Cases in Observability
There are several different use cases for time series metrics within the scope of observability. Below are three of the most popular use cases, along with the particular time series metrics used for each.
1. System Performance Monitoring
Network engineers and administrators need time series data to holistically view network health and performance to ensure reliable network services. By analyzing these metrics, organizations can:
- Identify performance trends
- Detect anomalous behavior
- Make informed decisions to maintain system efficiency
Here’s an example of utilizing time series metrics for system performance monitoring:
| Time | CPU Usage (%) | Memory Usage (%) | Disk I/O (MB/s) |
|---|---|---|---|
| 10:00 AM | 30 | 40 | 5 |
| 10:05 AM | 35 | 45 | 6 |
| 10:10 AM | 40 | 50 | 7 |
In this example, the time series metrics for CPU usage, memory use, and disk I/O help monitor server performance, highlighting resource utilization over time. Analyzing these metrics helps network teams identify performance trends and potential issues, ensuring optimal resource management and system performance.
2. Application Performance Management (APM)
Time series metrics are vital in APM for tracking application performance, identifying bottlenecks, and enhancing the user experience. These metrics capture data points consistently over time, providing a comprehensive view of application behavior.
By continuously monitoring these metrics, organizations can quickly identify and address issues that affect application performance, ensuring optimal functionality and user satisfaction.
Here’s an example of using time series metrics for APM:
| Metric | Description |
|---|---|
| Response Times | Time taken for applications to respond |
| Error Rates | Frequency of application errors |
| Throughput | Number of transactions processed per second |
These metrics help understand how well applications perform under different conditions and load levels, ensuring they meet user expectations.
For example, by monitoring response times, an e-commerce platform can ensure that pages load quickly, enhancing user satisfaction. Furthermore, tracking metrics like error rates can help identify and fix issues that could disrupt transactions, such as payment processing errors within the system.
Monitoring throughput ensures the platform can handle many simultaneous transactions during sales events, enabling smooth and efficient operation.
3. Security Monitoring
Time series metrics are also utilized for security monitoring. They help detect unusual activity and prevent potential security threats by providing a historical record of security-related events. By analyzing these metrics, security teams can identify patterns that indicate malicious behavior and take proactive measures to safeguard the system.
Here’s how time series metrics can be utilized for security monitoring:
- Real-time Monitoring and Alerts: Detect spikes in login attempts, network traffic, and resource usage.
- Anomaly Detection: Identify deviations in user behavior and process activities.
- Historical Analysis and Forensics: Trace attack vectors and assess breach impacts.
- Predictive Security: Forecast potential threats and allocate resources efficiently.
- Automated Response: Implement automatic threat mitigation and system isolation.
- Compliance and Reporting: Maintain audit trails and generate security incident reports.
To illustrate the use of time series metrics in security monitoring, consider the following example:
| Time | Login Attempts | Failed Attempts | Anomaly Detected |
|---|---|---|---|
| 10:00 AM | 100 | 5 | No |
| 10:05 AM | 120 | 10 | No |
| 10:10 AM | 200 | 50 | Yes |
In this scenario, time series metrics track login and failed attempts. At 10:00 AM, the metrics show 100 login attempts with five failures, indicating regular activity. By 10:05 AM, the login attempts slightly increased to 120 with 10 failures, which is still within an acceptable range but warrants monitoring.
However, at 10:10 AM, the login attempts jump to 200 with 50 failures. This significant spike in failed attempts triggers anomaly detection. The security team suspects a brute-force attack, where an attacker tries many password combinations to gain access.
Best Practices for Managing Time Series Metrics
Managing time series metrics is crucial for maintaining the performance and reliability of modern applications and infrastructure. Ensuring these metrics are accurate, meaningful, and actionable requires strategic planning, proper tooling, and best practices.
Here are some of the best practices for managing time series metrics:
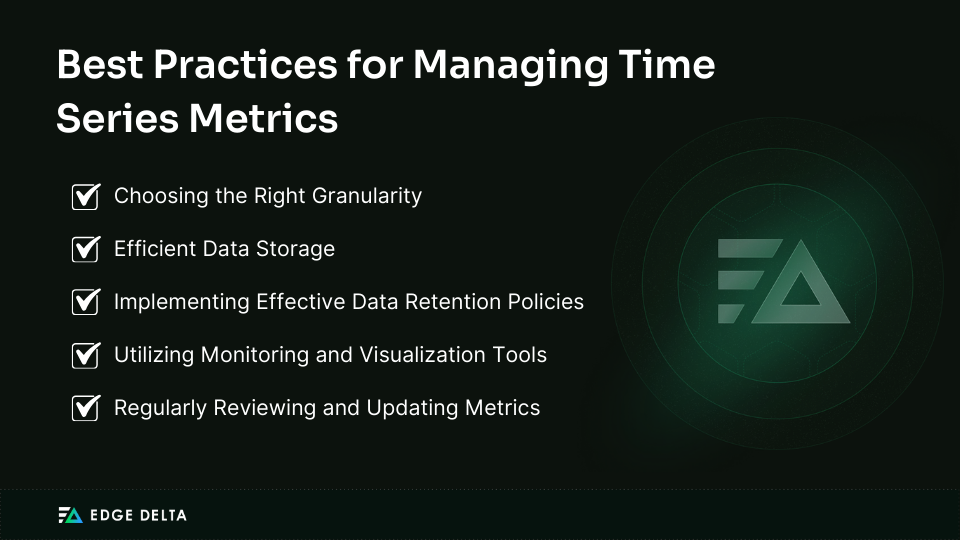
1. Choosing the Right Granularity
Granularity in this context refers to the time interval used between recordings of the data value to create the associated metric. When choosing granularity, consider your business objectives, the types of insights needed, and your data storage and processing capabilities. The granularity level determines the depth of analysis possible and the insights that can be drawn from the data.
High granularity is ideal for applications requiring real-time insights and rapid responses. It captures data at finer intervals, offering detailed and nuanced analysis that can identify subtle patterns and short-term fluctuations. This level of detail is valuable for real-time monitoring and precise anomaly detection, but it demands more storage space and robust processing capabilities.
Conversely, low granularity aggregates data over longer intervals, providing a broader overview for identifying long-term trends and strategic decision-making. It is more storage-efficient and simplifies data processing, though it may miss finer details.
Ultimately, the choice should balance the benefits of detailed data against the costs of storage and processing. Ensure your data collection strategy meets your business objectives efficiently.
Here’s the trade-off between high granularity and low granularity:
| Granularity | Pros | Cons |
|---|---|---|
| High(e.g., per second collection) | * Provides detailed insights for precise analysis |
- Enables real-time monitoring for quick anomaly detection
- Better detection of short-lived events and anomalies
- Improved capability for diagnosing and troubleshooting issues quickly | - High storage and processing costs
- Increased complexity in data management
- Potential strain on system resources
- Higher operational costs due to resource utilization | | Low(e.g., hourly collection) | * Reduced storage costs and data volume
- Simplifies data management and retention
- Lower processing requirements, leading to more efficient management
- Minimal impact on system resources, ensuring smoother operations | - Less detailed insights, potentially missing transient anomalies
- Less effective for real-time monitoring
- Limited ability for in-depth and precise diagnostics
- Broader patterns and trends may be less apparent |
2. Efficient Data Storage
Efficient storage solutions for time series metrics are essential for managing large volumes of data generated over time. These solutions ensure the data is stored, allowing for efficient querying, retrieval, and analysis while minimizing storage costs.
Two critical approaches to achieving efficient data storage for time series metrics are time-series databases and data compression techniques.
- Time-series Databases
Time-series databases (TSDBs) are specialized databases optimized for storing and querying time-stamped data. They offer several benefits over traditional databases for time series data:
- TSDBs use data structures and storage formats explicitly designed for time-stamped data, which reduces storage space and improves performance.
- Provide efficient querying capabilities for time-based operations, such as aggregations and filtering by time ranges.
- Many TSDBs are designed to scale horizontally, handling large volumes of time series data across distributed systems.
- Data Compression
Data compression techniques reduce the storage footprint of time series data. By compressing the data, storage costs are lowered, and retrieval times are often faster due to the reduced volume of data that needs to be read from disk.
Some standard data compression techniques for time series data include:
- Lossless Compression: Techniques like run-length encoding, delta encoding, and dictionary compression preserve the original data without any information loss.
- Lossy Compression: This technique reduces data size by approximating the original data, making it suitable for use cases where some loss of precision is acceptable.
Many time-series databases incorporate built-in data compression to optimize storage and retrieval.
| Solution | Benefits |
|---|---|
| Time-Series Databases | Optimized for time-stamped data, efficient queries |
| Data Compression | Reduced storage costs, faster retrieval |
By leveraging these storage solutions, organizations can manage their time series data more efficiently, ensuring high performance and cost-effectiveness.
3. Implementing Effective Data Retention Policies
Establish appropriate data retention policies to manage storage costs while retaining sufficient historical data for analysis and compliance. Data retention policies are critical for managing the lifecycle of time series data, which is abundant and continuously generated by modern systems. These policies help strike a balance between data availability and storage costs.
Here are some key strategies for achieving this balance:
- Query Optimization
Enhance performance with indexing and other query optimization techniques, ensuring efficient data access and analysis even with large datasets.
- Policy Review and Adjustment
Review and update data retention policies regularly to align with changes in data generation rates, storage technologies, and business needs, ensuring ongoing efficiency and cost-effectiveness.
Here’s an example of a retention policy:
| Data Age | Retention Policy |
|---|---|
| 0-7 days | Short-term Data: Raw, high-resolution data for real-time monitoring and immediate analysis. |
| 7 days – 6 months | Medium-term Data: Aggregated hourly data used for weekly and monthly reporting. |
| 6 months – 5 years | Long-term Data: Aggregated daily data required for historical analysis, compliance, and audit purposes. |
4. Utilizing Monitoring and Visualization Tools
Monitoring and visualization tools, combined with a focus on time series data and other OpenTelemetry metrics, enable efficient collection and analysis. Organizations can make informed decisions, optimize operations, and ensure system reliability by leveraging a deeper understanding of such metrics. To maximize the benefits of monitoring and visualization tools, consider the following best practices:
- Centralized Dashboard Creation: Implement centralized dashboards that aggregate metrics from various sources, providing a unified view of system health and performance.
- Custom Alerts and Notifications: Set up custom alerts and notifications to deal with potential issues ahead of time.
- Historical Data Analysis: To understand long-term trends and seasonal patterns, historical data analysis will inform capacity planning, resource allocation, and future-proofing strategies.
- Interactive Visualizations: Implement interactive visualizations that allow users to drill down into specific metrics and periods, facilitating deeper understanding and root cause analysis.
- Integration With Other Tools: Ensure monitoring and visualization tools seamlessly integrate with other systems to improve data correlation and provide a holistic view of the environment.
- Performance Optimization: Use insights from monitoring tools to optimize performance. Identify bottlenecks, resource constraints, and inefficiencies for targeted improvements.
- Scalability: Choose monitoring tools that can scale with your infrastructure, handling increased data and complexity without sacrificing performance.
- Security and Compliance Monitoring: Implement monitoring practices focusing on security and compliance metrics to ensure the system adheres to regulatory requirements and security standards.
Check out this table of the best monitoring and visualization tools and their features:
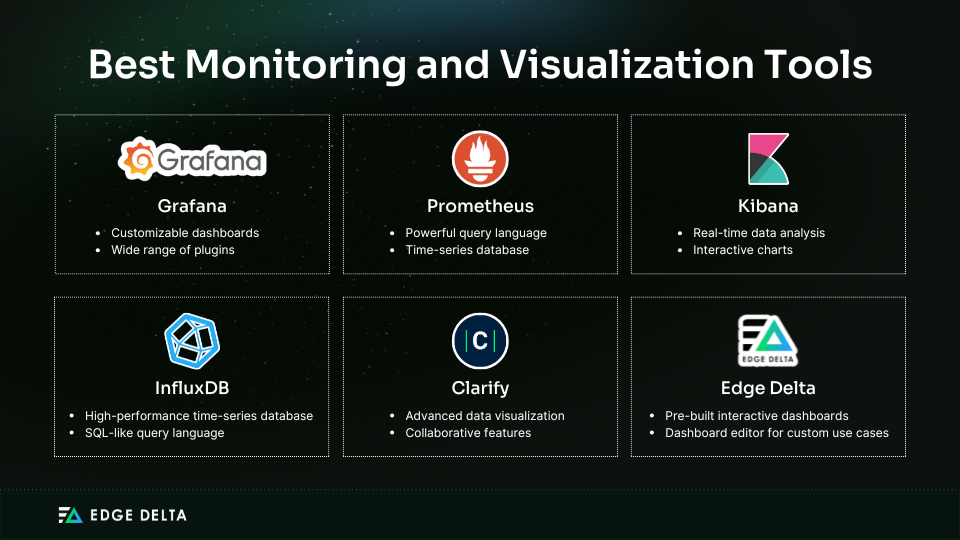
These tools offer various functionalities to enhance the monitoring and visualization experience, allowing users to efficiently manage and interpret their time series data.
5. Regularly Reviewing and Updating Metrics
Time series metrics are critical for monitoring and analyzing system performance and behavior. However, metric relevance and usefulness can diminish over time if they are not regularly reviewed and updated.
Ensuring that the collected metrics remain pertinent to the current operational context and organizational goals is essential for effective decision-making and system management.
Here are some of the best strategies for reviewing and updating metrics:
- Schedule Regular Reviews: Set a regular interval for reviewing your metrics, whether monthly, quarterly, or annually. Scheduling ensures consistent oversight and timely updates.
- Leverage Data Analytics: Use advanced analytics tools to monitor your metrics’ performance continuously. Automated alerts can signal when a metric is no longer providing helpful information.
- Document Changes: Record any changes to your metrics in detail. This documentation helps you understand their evolution and provides context for future reviews.
- Test and Validate: Before fully integrating updated metrics into your reporting, test and validate them to ensure they provide accurate and actionable insights.
- Stay Informed on Industry Trends and Best Practices: Metrics commonly used within your industry can serve as benchmarks and help align your performance monitoring with broader standards.
Conclusion
Time series metrics are crucial for understanding the dynamics of various data points over time, providing valuable insights into trends, patterns, and anomalies. They enable businesses to make informed, data-driven decisions and are integral to statistical analysis, forecasting, and system monitoring.
In observability, time series metrics are indispensable for tracking system performance, identifying issues in real-time, and guaranteeing the availability and effectiveness of applications and infrastructure. These metrics facilitate comprehensive monitoring and predictive maintenance by prioritizing time as the primary axis, enhancing overall system observability.
FAQs for Time Series Metrics
What are the four main components of a time series metric?
The four major components of a time series are trend, seasonal, cyclical, and irregular. The trend exhibits long-term movement, whereas seasonal elements are predictable patterns that change over time. The cyclical components are long-term, irregular fluctuations tied to economic cycles, and the irregular components are random, unpredictable variations.
How do you measure time series?
Measuring time series involves collecting data points regularly to track changes in a variable over time. It is essential for monitoring performance, spotting trends, and predicting future behavior.
Sources

