


Modern systems generate vast volumes of logs, metrics, and traces — and the real issues users feel first are often buried in that noise. Static, threshold-based alerts can’t keep up with shifting workloads, leading to false positives and missed regressions.
Anomaly detection changes the equation by learning normal behavior and surfacing meaningful deviations that impact reliability and user experience. Teams using it report cleaner alerts, faster triage, and fewer false alarms. According to Gartner (2024), organizations reduced alert noise by 30–50%, while Google’s 2023 SRE studies showed 15–40% faster recovery times.
This guide explores how anomaly detection strengthens observability through adaptive baselines, multi-signal correlation, and edge processing—improving accuracy, reducing costs, and cutting MTTR. It also introduces a phased rollout approach to help teams adopt anomaly detection with confidence and measurable impact.
Key Takeaways
• Adaptive baselines reduce false positives from 20-40% (static thresholds) to 5%-15% after proper training.
• Machine learning models detect novel patterns that rigid rules miss, including gradual degradation and multi-signal correlations.
• OpenTelemetry keeps instrumentation vendor-neutral, while edge processing architectures reduce central infrastructure costs by 60-80%.
• Successful adoption follows a pattern: start with one service, validate precision above 70% in shadow mode, then expand systematically.
Why Anomaly Detection Improves Observability
Observability delivers value when it transforms raw telemetry into timely, actionable insight. Static thresholds fail to adapt to seasonality, regional variation, or version changes, creating noise instead of clarity. Adaptive baselines learn these patterns, filtering out expected peaks and surfacing anomalies that truly affect users. This reduces false positives and speeds up detection of genuine regressions.
For example, a small post-deploy error spike is automatically correlated with its version and region, while a routine 9 AM traffic surge remains quiet. Related signals across metrics, logs, and traces are unified into a single incident—giving responders one clear narrative instead of multiple disconnected alerts.
Static Thresholds vs Learned Baselines
Choosing the right detection approach begins with signal quality and long-term maintainability. Static rules are simple to configure but fragile as systems evolve — they miss gradual drifts, trigger during routine peaks, and demand ongoing manual tuning.
Adaptive baselines evolve with traffic patterns, producing fewer, more meaningful alerts. This allows teams to focus on verification and response instead of constant rule maintenance.
| Dimension | Static Thresholds | Learned Baselines |
|---|---|---|
| Noise | High during predictable peaks | Typically 5-15% false positives |
| Novel issues | Rarely captured | Discovered as deviations |
| Maintenance | Frequent manual retuning | Self-adjusts with data |
| Context | One metric at a time | Multi-signal and time-aware |
| Setup time | Minutes to hours | Days to weeks for training |
| Best for | Known failures, hard limits | Complex systems with patterns |
With adaptive baselines, observability improves because the platform explains why something changed, not just that it changed. That context turns dashboards into decisions.
When Static Thresholds Remain Superior
Both approaches serve important roles. Static thresholds excel when limits must be precise and non-negotiable — such as CPU temperature, disk capacity, strict SLAs, security controls like failed logins, or compliance requirements that mandate fixed values.
Stripe’s infrastructure team illustrates this balance well. In their 2024 report, they noted that anomaly detection reduced alert volume by 45%, yet they intentionally kept static thresholds for payment-processing latency.
The reason is simple: payment delays have absolute, not relative, business impact. A 500 ms slowdown hurts revenue the same way whether it’s 2× or 5× above historical norms, making a fixed threshold the correct choice.
Faster Triage and Lower MTTR
Incident timelines shrink when detection happens early and alerts include meaningful context. Anomaly detection incorporates factors such as recent deploys, service version, region, and likely dependency hotspots, allowing engineers to begin with a smaller search space and a clearer initial hypothesis.
Correlation accelerates this further. Alerts automatically connect slow spans, first-seen error signatures, and affected endpoints—mirroring recent industry findings that contextual signal grouping drives faster root-cause analysis.
Instead of piecing together clues from multiple tools, responders follow a single, coherent narrative. Over time, these efficiencies compound as teams reuse validated runbooks and build on prior investigations.
| Phase | Before | After | Typical Improvement |
|---|---|---|---|
| Detection | 45 min | 5-15 min | 67-89% faster |
| Investigation | 120 min | 30-60 min | 50-75% faster |
| Total MTTR | 4 hr | 1-2 hr | 50-75% faster |
Results vary widely by system complexity and implementation quality. Google’s 2023 SRE study found MTTR improvements of 15–60%, driven by factors like team experience, instrumentation, and alert hygiene.
Automated remediation adds value, but expectations should be modest. A 2024 DORA survey found that only 23% of organizations with anomaly detection used automated remediation, and just 15–25% of incidents were fully resolved without human intervention.
When alerts are precise, confidence-gated automation can safely trigger reversible actions such as rollbacks, traffic shifts, or cache purges. A prudent path is to begin with recommendation-only workflows and progress to automated execution as reliability is demonstrated.
How Anomaly Detection Elevates Metrics, Logs, and Traces
Each signal type contributes distinct insights, and together they form a single, enriched incident that accelerates investigation and response.
- Metrics
Metrics benefit from adaptive baselines on latency, saturation, and error rates—surfacing meaningful changes early without triggering alerts during predictable cycles. Quantile checks focus on tail behavior, where user experience often degrades first. A 3% error rate jump is noteworthy when the baseline is only 0.1%, even if it remains below a fixed 5% threshold. With edge processing, these statistical evaluations run close to the source, reducing detection latency and minimizing the volume of raw metrics sent to central systems.
- Logs
unusual bursts without relying on hand-written rules. Maturity matters, though.
Shopify’s engineering team ran into this in 2024 when early log-anomaly models flagged every deployment as an incident. New code paths naturally produced unfamiliar log patterns, triggering false alerts. They resolved it by correlating anomalies with deployment events and adding a 10-minute post-release settling window, allowing the model to ignore expected deployment noise and focus on true issues.
- Traces
Traces benefit from span-level scoring that highlights slow components, atypical call paths, and emerging dependency regressions. This works best with comprehensive instrumentation and sampling strategies designed to retain anomalous traces—not just random subsets.
When traces, metrics, and logs converge on a shared timeline, the investigative path becomes far clearer, enabling faster and more confident diagnosis.
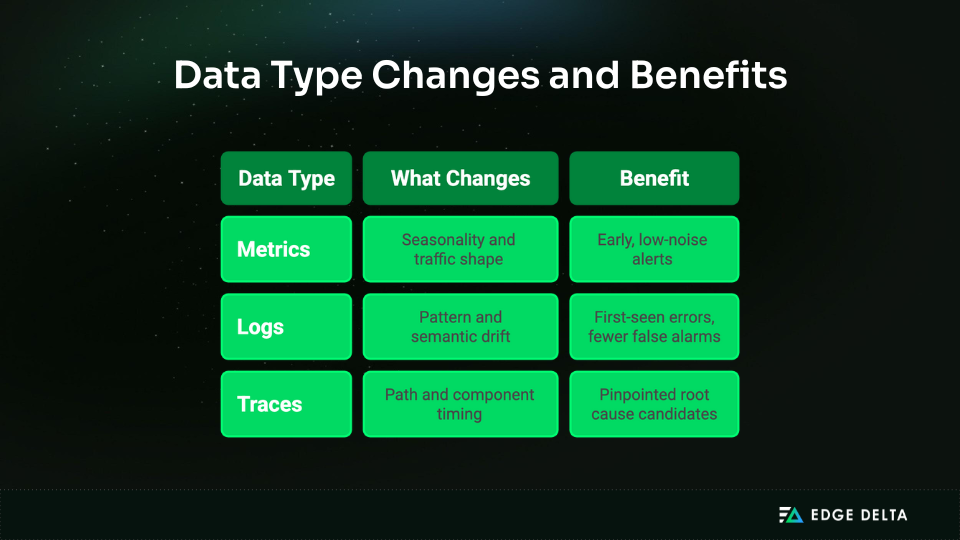
When a metric deviates, responders jump straight to the slow spans and the matching error patterns. The platform moves from raw signals to an actionable story.
A Four-Phase Implementation That Builds Trust
Adoption moves fastest when it is deliberate and measurable. The plan below keeps momentum high while protecting on-call trust.
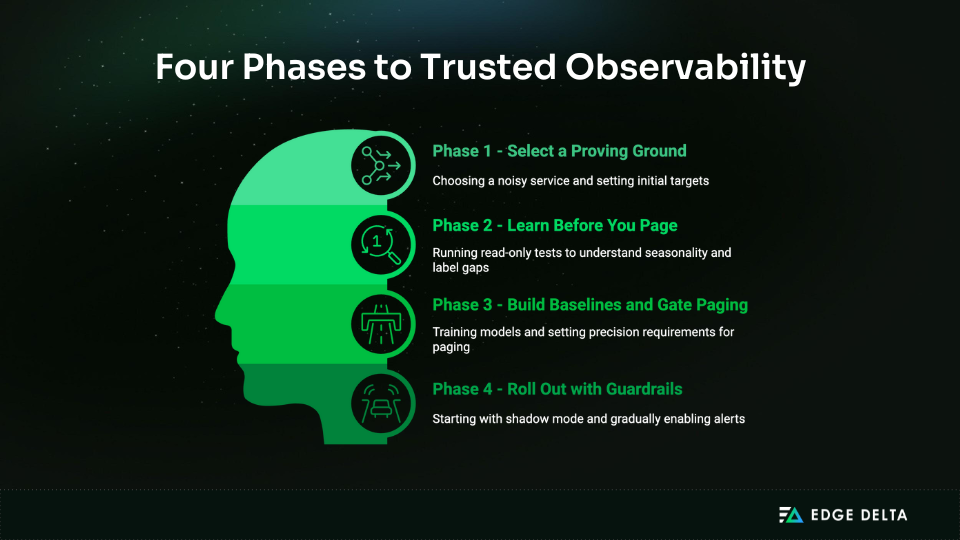
Phase 1: Select a Proving Ground
Choose one noisy, high-impact service with clear SLOs. Baseline current precision, paging volume, and MTTR. Then set targets: precision (>70% for informational alerts, >90% for paging), recall on known incidents, and overall alert reduction.
Standardize on OpenTelemetry for instrumentation so exporters and semantics stay portable across vendors. This matters more than it seems, especially when shaping a scalable observability architecture that can evolve without constant reinstrumentation.
Teams tied to proprietary instrumentation risk rising costs and limited capabilities. OpenTelemetry-native observability platforms (like Edge Delta) preserve ecosystem compatibility while offering vendor-specific enhancements.
The most common mistake at this phase is skipping baseline measurement entirely. Without a documented current state, you cannot prove improvement later or justify continued investment.
Phase 2: Learn Before You Page
Pick a stack that integrates cleanly, explains results, and controls cost. Run read-only for 2-4 weeks to learn seasonality and expose label gaps. Map alerts to runbooks so next steps are obvious and repeatable.
Shadow mode exposes real-world precision under your actual traffic. In Lyft’s 2023 pilot, their observability team’s first 30-day shadow run caught 8 of 10 major incidents but produced over 150 false positives.
Rather than abandoning the approach, they added service-level context (region, version, customer tier) and tightened confidence thresholds. In the following evaluation period, false positives dropped to 12 while maintaining the detection of 7 out of 10 incidents.
The decision point is clear: move forward only when precision exceeds 70% in shadow mode. Lower precision erodes on-call trust faster than you can rebuild it.
Phase 3: Build Baselines and Gate Paging
Use about 30 days of representative traffic to train and backtest against real incidents. Set stricter precision requirements for paging and route exploratory detections to chat while models learn. Version models and features to keep rollbacks simple after major releases.
Data quality determines model quality. A financial services company discovered this during their 2024 rollout when they achieved 90% false positives because services used inconsistent names (payment-api, payment_service, paymentsvc).
The model couldn’t correlate related signals across their microservices. After standardizing on OpenTelemetry semantic conventions, false positives dropped to 12%. The lesson: audit instrumentation consistency before investing in sophisticated detection.
Minimum training data: 2-4 weeks supports fundamental baselines. 30 days improves seasonality handling. Continue retraining as traffic and schemas evolve.
Phase 4: Roll Out with Guardrails
Start in shadow mode, enable low-severity alerts with rate limits, then add critical paging once precision is proven. Introduce automation only where playbooks are mature and reversible. Track weekly scorecards for precision, recall, MTTR, and cost per actionable alert.
Progressive paging strategy:
- Weeks 1-2: Informational alerts to Slack/Teams
- Weeks 3-4: Enable paging for degraded service (SEV-2)
- Weeks 5-6: Enable paging for outages (SEV-1) if confidence is high
This phased rollout protects the most valuable asset in incident response: team trust in the alerting system.
Cutting Noise Without Losing Coverage
As a rollout progresses, the tension between catching all real issues and avoiding false alarms becomes the central operational challenge. Noise erodes trust, so precision must rise without blinding detection to real risk. Several techniques address this balance.
- Context features like region, version, zone, and customer tier separate harmless variation from real incidents. A latency spike in a beta load test can look like a production outage in raw metrics. Context makes the difference clear.
- Two-stage validation confirms model scores with a statistical check so transient spikes do not trigger interruptions:
IF model detects anomaly AND absolute value > minimum:
    IF sustained for > X minutes:
        IF not in maintenance window:
ALERT- Dynamic thresholds track seasonality and keep expected peaks quiet. Instead of “API latency is high,” enriched alerts state: “API latency for enterprise customers in us-west-2 is 3.2 standard deviations above baseline for this hour, started 5 minutes after deploying v2.4.1.”
- Operator feedback on every page drives retraining and steadily improves alert quality. Organizations with mature feedback loops see continuous gains over time, while those without plateau after initial deployment. The key is treating anomaly detection as a learning system, not a one-time setup.
These practices create a smaller, higher-quality alert stream. Responders trust what they see, react faster, and protect error budgets more consistently.
Cost Control That Protects Signal Quality
Effective anomaly detection depends on comprehensive telemetry, but that telemetry can quickly drive an increase in cost. The challenge is preserving signal quality while controlling spend. Three architectural patterns address this.
- Intelligent sampling keeps 100% of errors and slow requests while reducing collection on healthy traffic. Tail-based sampling makes this decision after seeing the complete request, not before.
Datadog’s 2024 engineering presentation highlighted one customer who cut trace ingestion costs by 73% using tail-based sampling—retaining 100% of error traces while sampling only 1% of successful ones. The result: full visibility into failures at a fraction of the cost.
- Edge processing moves filtering, aggregation, and first-pass anomaly detection closer to data sources before telemetry reaches central systems, a proven way of cutting downstream ingestion costs while keeping full visibility. This architectural shift reduces both data transfer costs and detection latency.
Edge Delta and similar platforms analyze telemetry at the collection point, applying statistical checks and pattern matching locally. Instead of shipping full raw streams, they forward only anomalies, summaries, and a small sample of baseline traffic.
The cost impact is substantial: teams operating high-volume distributed systems report 60–80% reductions in data transport and centralized compute. Detection latency also improves because issues are identified at the source rather than after a round trip to a central system. The trade-off is added operational complexity—detection logic must stay synchronized and consistently updated across all collection points.
Tiered retention aligns storage costs with data value over time:
- Hot (7-15 days): Active investigation on fast storage, high cost
- Warm (30-90 days): Trend analysis and retrospectives, medium cost
- Cold (1+ year): Compliance and long-term analysis, low cost
Enrich only what matters. Attach deployment metadata, schema changes, and feature flags to anomalous events—context that meaningfully accelerates diagnosis.
Routine telemetry doesn’t require high-cardinality details. Finance and engineering stay aligned when the focus shifts from cost per GB stored to cost per actionable alert, ensuring spending supports real operational outcomes rather than raw data volume.
Platform Choices Through an Observability Lens
Tool selection should reflect how anomaly detection strengthens observability in your specific environment, balancing speed-to-value with control and cost.
Cloud-native options in AWS, Azure, and GCP offer fast adoption and tight integration with their alerting ecosystems. Just ensure the baselines are SLO-aware and that explanations are clear enough for on-call responders.
AWS CloudWatch Anomaly Detection saw major improvements in 2024 with multi-metric correlation. Earlier versions evaluated signals independently, generating excess false positives and undermining trust — an issue now largely resolved.
- Open-source stacks like Prometheus and OpenTelemetry provide flexibility and vendor independence for teams able to manage their own operations. You take on the operational burden but gain control and lower costs at scale, ideal for organizations with strong platform engineering and unique requirements unmet by commercial tools.
- Commercial observability platforms like Datadog, New Relic, Dynatrace, and Splunk accelerate correlation and onboarding with mature ML models and professional support. These platforms invest heavily in multi-signal correlation and explainability. Validate precision with your traffic in read-only mode for 30 days before enabling paging. The cost is real, but so is the time-to-value for teams without deep ML expertise.
- Hybrid architectures combine strengths and have become the pragmatic choice for many organizations:
Applications (OpenTelemetry SDK)
↓
Edge processing layer (filter, aggregate, detect)
↓
Central storage (long-term retention, correlation)
↓
Analysis and alerting (anomaly detection, dashboards)
This model leans on OpenTelemetry for portable instrumentation, uses edge platforms like Edge Delta for efficient collection and early detection, relies on open-source components for flexible storage, and layers in commercial tools only where they deliver clear value. As your requirements shift, the architecture can evolve without forcing a full reinstrumentation.
Ultimately, the right fit is the one that consistently cuts noise, expands visibility, and reduces MTTR while staying within your cost and control boundaries. Always validate in shadow mode against real traffic before allowing anything to page production.
When Anomaly Detection Isn’t the Answer
Skip anomaly detection when:
- Your system is simple and stable with predictable traffic. Static thresholds are sufficient and easier to understand.
- You have poor instrumentation. Fix basic observability first. Garbage in, garbage out.
- Your team lacks ML expertise, and vendor budgets are constrained. Operating this requires understanding model behavior and debugging false positives.
- Compliance requires explicit thresholds. Some regulations mandate documented threshold values for audits.
- Your “normal” constantly changes with daily architectural shifts. Wait until the system stabilizes.
- You haven’t solved basic alerting. If you can’t keep runbooks updated or respond within SLO, anomaly detection generates more alerts to ignore.
Better starting points include: SLOs and error budgets, structured logging, basic metrics with sensible static thresholds, and clear on-call rotation.
Operational Playbooks That Keep Results Durable
Sustained gains come from consistent habits that become second nature.
- Clear paging policies separate signal from noise. Page only for anomalies that threaten error budgets or latency objectives. Route lower-severity findings to chat for review during business hours. The threshold matters: paging alerts need greater than 90% precision, or on-call engineers start ignoring them.
- Correlation by default means metric, log, and trace context arrives together. Engineers work a single narrative instead of hunting across tools. This requires instrumentation discipline. Services need consistent naming. Traces need complete context propagation. The payoff is investigation time that drops from hours to minutes.
- Runbook integration attaches clear next steps to every alert. Track which runbook steps get used most. This reveals automation opportunities and documentation gaps. When the same manual step appears in 80% of incidents, automate it.
- Scheduled maintenance keeps models current. Monitor drift and retrain quarterly. Track model and feature versions to keep changes auditable. Review precision and recall weekly during rollout, monthly after stabilization. Systems evolve, and baselines must evolve with them or accuracy degrades.
These routines anchor precision and responsiveness as traffic grows and services evolve. Teams that treat anomaly detection as a learning system see continuous improvement. Teams that set and forget see performance plateau within months.
Measuring Success
Track metrics that reflect actual value:
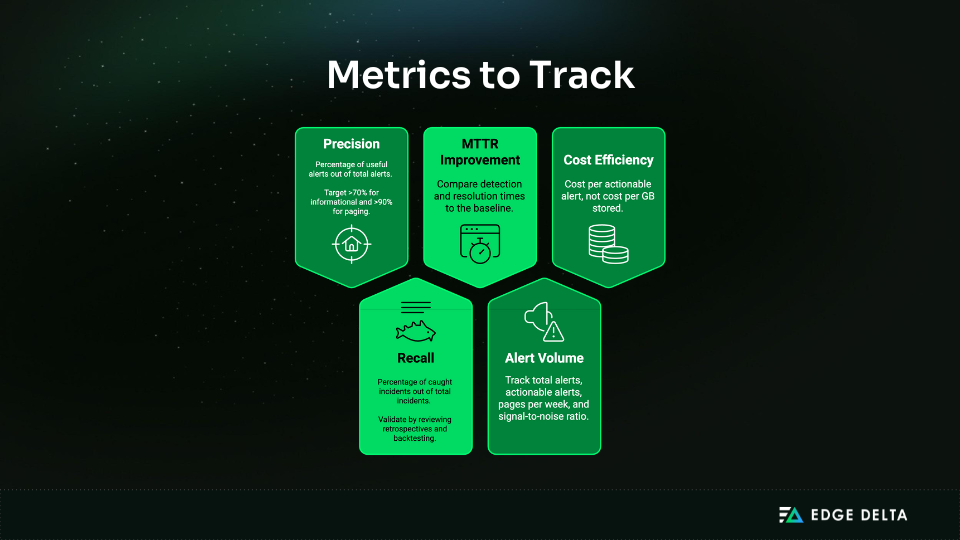
Measurement pitfall: MTTR improvements may come from better runbooks or team experience, not just anomaly detection. Be honest about confounding factors.
Future-Ready Patterns for Better Observability
Anomaly detection becomes a foundation for safe automation once confidence is established. Begin with recommend-only actions and graduate to auto-executed rollbacks, traffic shifts, and cache purges where playbooks are mature.
OpenTelemetry strengthens portability across vendors and speeds onboarding for new services.
Edge-aware detection shortens feedback loops for high-volume or remote sites while protecting cost, especially valuable for observability in containerised environments where scale and latency challenges are most acute.
As these patterns mature, the platform delivers higher signal quality at lower operational overhead.
Conclusion
Anomaly detection strengthens observability by turning raw telemetry into clear, context-rich alerts that map to SLOs, streamline triage, and shorten MTTR.
Using OpenTelemetry for portability, adding edge processing where it makes sense, and rolling out gradually ensures you prove precision before anything pages. The result is straightforward and repeatable: earlier detection, fewer interruptions, and faster recovery.
Start with a single high-impact service, measure rigorously, confirm alert precision exceeds 70% before paging, and expand incrementally as confidence grows.
FAQs on How Anomaly Detection Improves Observability
How is this different from threshold alerts?
Thresholds don’t adapt to traffic patterns or gradual changes. Learned baselines cut false positives from 20–40% to 5–15% and catch anomalies missed by static rules. Static thresholds still work best for hard limits and strict SLAs.
How soon do benefits show up?
Benefits typically appear within six months. Most organizations see 30–40% noise reduction in the first two months as baselines stabilize, followed by 15–40% MTTR improvement by month four. Downtime cost savings emerge around month six as earlier detection prevents escalations. Google’s 2023 SRE research found that this timeline is consistent across industries and organization sizes.
Can this work with legacy systems?
Yes. Network flows, host metrics, and log patterns provide enough signal to build baselines even without modern instrumentation like distributed tracing. Start with SLO-linked metrics that directly reflect user experience and add context as telemetry improves. However, correlation across data types requires consistent service naming and labeling, which legacy systems often lack. Plan instrumentation improvements in parallel with anomaly detection adoption.
How much history is required?
Two to four weeks of data capture daily patterns for basic baselines. Around 30 days adds weekly and monthly cycles. Systems with strong seasonality benefit from 60–90 days. Retrain regularly as traffic or architecture changes. Include known incidents in the data but label them separately so models learn to detect, not normalize, those events.
What should we measure to prove success?
Measure precision (useful alerts requiring action), recall from incident retrospectives, MTTR before/after rollout, pages per incident, and cost per actionable alert (not per GB). Track weekly during rollout, then monthly after stabilization. Record baseline metrics and note confounding factors like team experience, infrastructure changes, or better runbooks.
Sources and Research

