


Kafka is foundational to many data pipelines, but monitoring it effectively is notoriously challenging. Each broker exposes a wide range of JMX metrics, consumer lag can span thousands of partitions, and high cardinality quickly turns visibility into noise.
Teams often swing between two extremes: tracking too few signals and missing issues, or collecting everything and drowning in alerts. On top of that, maintaining a clear picture across producers, brokers, and consumers adds another layer of complexity.
This guide outlines the metrics that actually matter, compares monitoring approaches and their cost implications, and presents a practical framework for keeping Kafka observability accurate, actionable, and manageable.
Key Takeaway
• Kafka requires a strict, proactive approach, as silent failures can go unnoticed until they result in data loss.
• JMX exposes valuable data but demands careful configuration to avoid gaps or security risks.
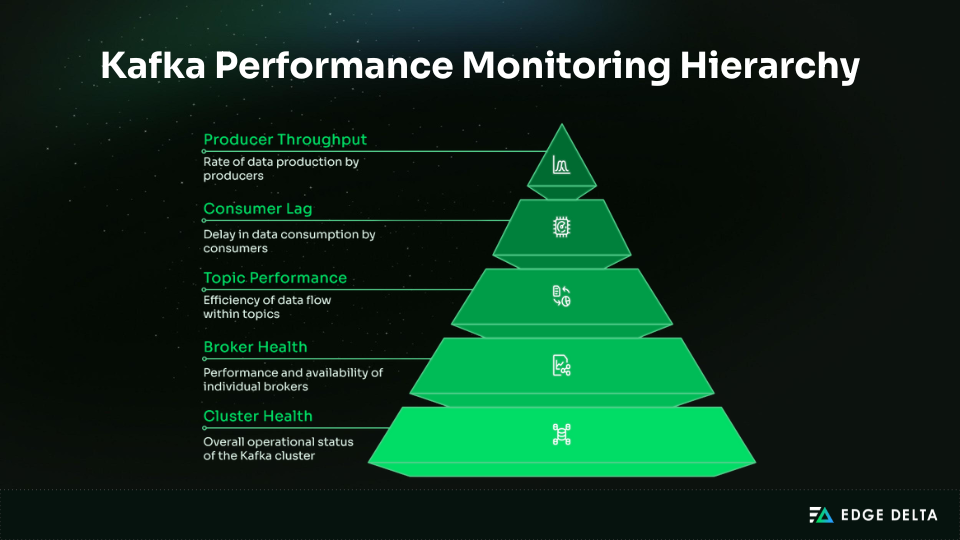
• Prioritize cluster health metrics before diving into broker, topic, or application metrics.
• Consumer lag is the top warning signal and must be monitored continuously.
• Monitoring ISR shrinkage is essential, as offline partitions only become visible after multiple silent failures.
• High-cardinality setups can generate tens of thousands of time series, which can overwhelm the system.
Why Kafka Monitoring is Uniquely Challenging
Kafka’s distributed architecture introduces unique monitoring challenges. As systems scale, the volume and granularity of Kafka metrics can grow rapidly, making it difficult to separate meaningful signals from noise. Understanding how Kafka’s design generates this data is key to managing complexity effectively.
The Distributed System Challenge
Kafka’s complexity arises from its large-scale architecture. Each broker, topic, partition, and consumer group quickly multiplies the total metrics generated.
- Example calculation:
5 brokers × 200 topics × 10 partitions × 5 consumer groups = 50,000 metric combinations
- Per‑partition lag monitoring:
50,000 partitions × 3 metrics (lag, rate, offset) = 150,000 time series
- Scrape frequency impact:
150,000 × 5,760 (15‑second intervals per day) = 864 million data points daily
This volume of data can overwhelm monitoring backends like Prometheus, turning routine observability into a storage and performance challenge.
The Silent Failure Problem
Kafka can experience silent failure modes where it continues serving traffic even as replication safety degrades. The number of in-sync replicas (ISR) may drop from three to two, then to one, without triggering alerts or impacting clients. Data loss only occurs when the final replica fails.
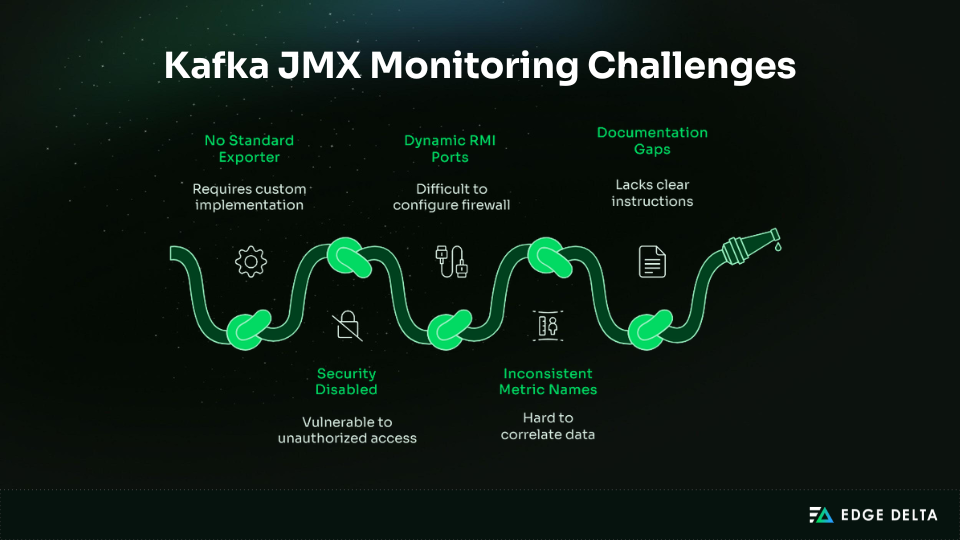
The JMX Configuration Nightmare
Java Management Extensions (JMX) is a common source of friction in Kafka monitoring. Because it was not designed with modern operational workflows in mind, teams regularly encounter issues during setup, scaling, and ongoing maintenance.
The Consumer Lag Dilemma
Consumer lag is one of the most important early indicators of trouble in Kafka, often revealing processing slowdowns before they impact producers or downstream systems.
The difficulty lies in its distribution across the cluster. Lag is tracked per consumer group, topic, and partition, generating a large number of individual signals. To make this data actionable and avoid alert fatigue, teams must aggregate and evaluate lag at the consumer group level rather than treating each partition in isolation.
Critical Kafka Metrics (What Actually Matters)
Kafka exposes hundreds of metrics, but effective monitoring depends on narrowing your focus to the signals that matter most. Prioritizing a small, high-impact set helps teams maintain cluster health without drowning in noise.
As a starting point, aim for 10–15 core metrics. This focused baseline captures the majority of operational issues while keeping monitoring overhead and on-call fatigue under control.
Tier 1: Cluster-Level Critical Metrics (Monitor First)
Five metrics reveal the most serious failures in Kafka and should anchor any monitoring strategy: each illustrates a core aspect of cluster health and often serves as the first warning. By focusing on these metrics, you can reduce noise and improve incident response.
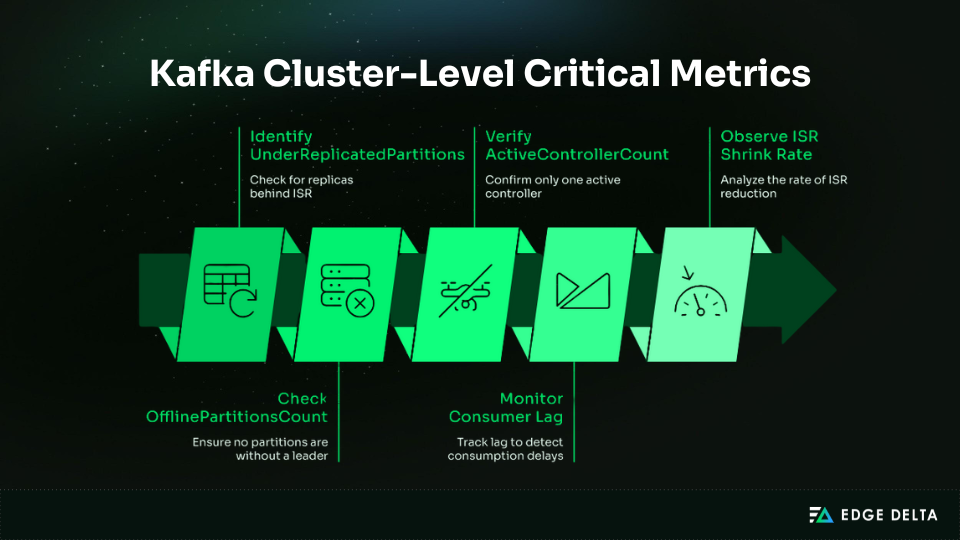
| Metric | What It Indicates | Alert Guidance |
|---|---|---|
UnderReplicatedPartitions | ISR count below the replication factor | >0 for 5 min |
OfflinePartitionsCount | No partition leader | >0 (page immediately) |
ActiveControllerCount | Number of active controllers | ≠1 (critical) |
Consumer Lag | Messages not yet consumed | >100k or rising rapidly |
ISR Shrink Rate | Replicas falling out of sync | >1/sec sustained |
Tier 2: Broker Health Metrics (Add Next)
After the cluster’s critical signals are in place, the next step is to track broker-level performance. These four metrics help identify bottlenecks, capacity issues, and slowdowns before they impact producers and consumers.
| Metric | What It Indicates | Alert Guidance |
|---|---|---|
Request Rate | Produce/Fetch requests per second | >2× baseline (investigate) |
Request Latency P99 | 99th percentile request latency | >500ms Produce, >1000ms Fetch (warning) |
Broker CPU/Memory/Disk I/O | System resource utilization | CPU >80%Memory >90%, Disk I/O wait >20% |
Log Flush Latency | Time to flush data from OS cache to disk | >100ms P99 (warning) |
Tier 3: Producer/Consumer Application Metrics (Context)
Application-level metrics, like the ones below, provide important context about how producers and consumers interact with Kafka.
Record Send Rate: Establishes producer throughput and highlights traffic shifts.Producer Request Latency: The time it takes producers to receive acknowledgements.Record Error Rate: Surfaces failed writes and reliability issues.Records Consumed Rate: Indicates consumer throughput and processing speed.Commit Rate: Reflects the health of offset management and consumer progress.Rebalance Rate: Reveals consumer group instability; frequent rebalances signal configuration or resource problems.
Metric Priority Framework
To avoid alert fatigue and manage metric noise, you should prioritize Kafka metrics to monitor. This will provide a framework as to what should drive immediate action versus what should support planning or troubleshooting.
| Priority | Focus Area | Included Metrics | Alert Style | Check Interval |
|---|---|---|---|---|
| P0 | Immediate cluster health | Offline partitions, controller availability | Page on-call | 15 seconds |
| P1 | Data safety risks | Under-replication, ISR shrink events, consumer lag | Warning or critical | 30 seconds |
| P2 | Performance signals | P99 request latency, traffic throughput | Performance warning | 1 minute |
| P3 | Capacity planning | CPU, memory, disk I/O | Informational alerts | 5 minutes |
| P4 | Deep diagnostics | Per-partition or detailed metrics | On-demand only | As needed |
Kafka Monitoring Tools Comparison
Choosing a Kafka monitoring solution will depend on team size, budget, and operational experience. Some provide full control, requiring substantial engineering effort, while others deliver quicker results out of the box at a higher ongoing cost.
Option 1: Native Kafka Tools (Free, Manual, Limited)
Kafka’s native tooling provides basic visibility free of charge and is good for development or quick triage. They expose consumer lag, JMX metrics, and broker logs.
| Category | Details |
|---|---|
| Tools Provided | • kafka-consumer-groups.sh for consumer lag • JConsole/JMXTerm for JMX metrics • broker logs in /var/log/kafka |
| Strengths | Free, immediate access, no additional infrastructure |
| Limitations | • Manual checks • No alerting or dashboards • No long-term data • Poor scalability |
| Best For | Development use, learning Kafka, and emergency triage |
Option 2: Prometheus + Grafana (Free Software, High Setup Cost)
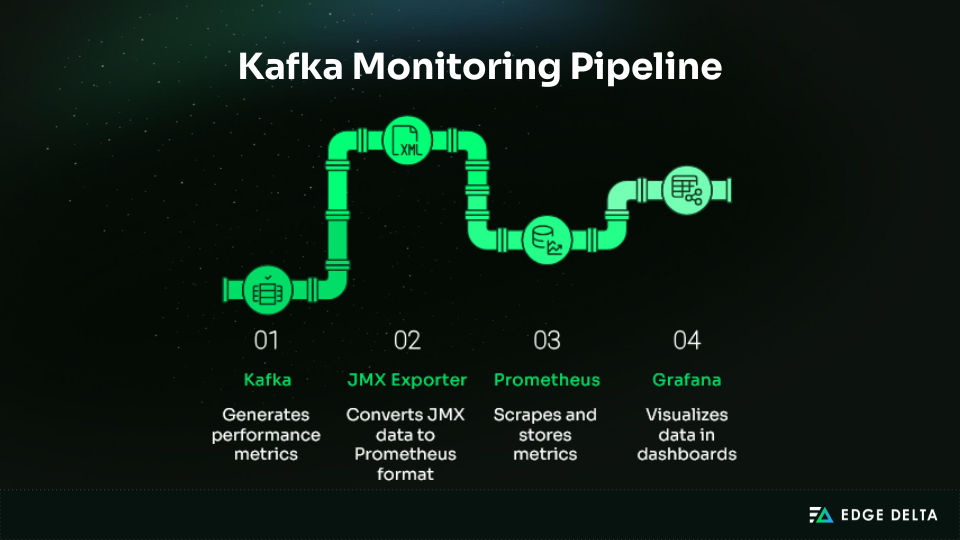
Prometheus and Grafana are widely used open-source tools for Kafka monitoring. They offer extensive flexibility, but managing Kafka metrics at scale requires substantial setup and ongoing tuning.
Teams must deploy and maintain the JMX Exporter, configure Prometheus to handle high-cardinality metric sets, and design dashboards that surface actionable signals rather than raw volume.
Key considerations:
- Setup effort: 40–80 hours upfront, plus 10–20 hours monthly maintenance
- Operational overhead: Continuous tuning of Prometheus storage, alerting rules, and Kafka metric volume
- Cost: $70–$140/month for small clusters, $340–680/month for larger ones
- Best for: Teams with strong SRE/DevOps capacity seeking flexibility without vendor lock‑in
Option 3: Datadog (Enterprise, Turnkey, Expensive)
Datadog offers a streamlined approach to Kafka monitoring with automatic broker discovery and prebuilt dashboards, minimizing the need for manual JMX configuration.
This lowers the operational overhead of setup and ongoing maintenance, making it well suited for teams without dedicated SRE capacity or those prioritizing faster time to visibility over deep customization.
| Cost | $1,000–3,000/month |
|---|---|
| Strengths | Unified metrics, logs, and traces; solid Kafka integrations |
| Tradeoffs | High cost at scale and vendor lock-in |
Option 4: Confluent Control Center (Kafka-Specific, Vendor Lock-in)
Confluent Control Center Kafka provides monitoring for lag, topics, Connect, and ksqlDB. It is best for teams already using Confluent Enterprise.
| Cost | $1,500–10,000+/year |
|---|---|
| Strengths | Deep Kafka-native insights, integrated admin and monitoring |
| Limitations | Kafka-only visibility, requires Confluent Platform |
| Best For | Organizations standardizing on Confluent |
Option 5: New Relic / Other Commercial APM
Commercial APM platforms such as New Relic provide consolidated, single-pane-of-glass monitoring with predictable pricing and solid Kafka integrations. They are often easier to budget for than Datadog, but typically offer fewer Kafka-specific capabilities, smaller Kafka-focused communities, and require more configuration to achieve deep Kafka observability.
- Cost: $400–1,500/month (Kafka)
- Savings: 3–5xcheaper than Datadog
- Best for: Teams seeking simpler, lower‑cost monitoring with commercial support
| Approach | Setup Effort | Cost (5 brokers) | Best For | Avoid If |
|---|---|---|---|---|
| Native CLI | None | $0 | Dev and quick fixes | Full production monitoring |
| Prometheus + Grafana | High | $200–400 + engineering | Full control at scale | Small teams |
| Datadog | Very low | $1,000–#2,000 | Fast, unified monitoring | Budget-constrained teams |
| Control Center | Moderate | $1,500–$10,000/yr | Confluent Platform users | OSS Kafka users |
| New Relic | Moderate | $400–$1,000 | Lower-cost enterprise option | Deep Kafka-specific needs |
Consumer Lag Monitoring (The Most Critical Metric)
Consumer lag is one of the clearest indicators of Kafka health because it measures how far consumers fall behind incoming data. It exposes processing bottlenecks early, highlights slow or failing consumers, and provides a direct signal for scaling decisions and performance tuning.
Understanding Consumer Lag
Consumer lag reflects processing delay by showing how far a consumer is behind the latest message in a partition. Per partition, it is calculated as:
Consumer Lag = Log End Offset – Consumer Offset
For example, if the producer is at 10,000 and the consumer is at 9,500, the lag is 500 messages.
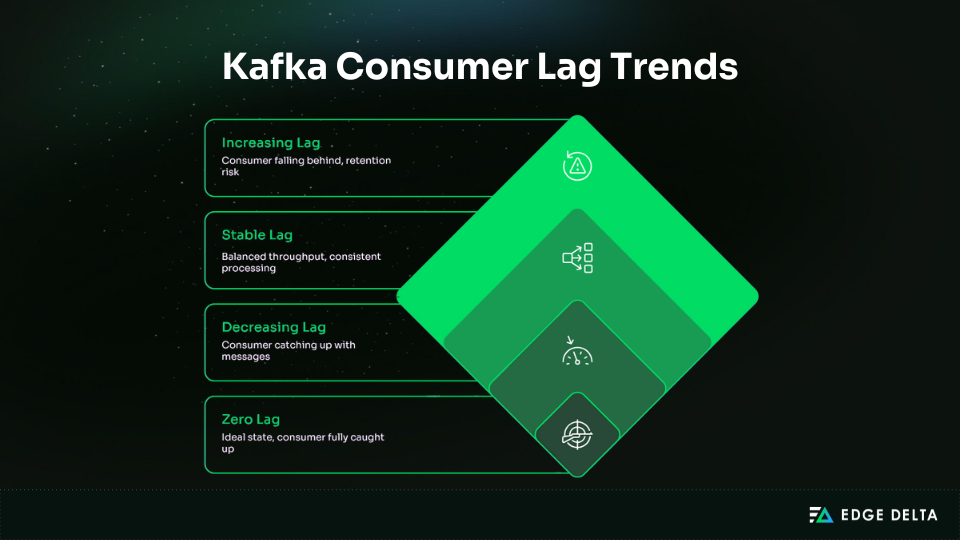
Types of Lag Problems
Different lag patterns provide immediate insight into how a consumer is behaving under load. Recognizing these patterns helps distinguish between a stalled consumer, an underpowered one, and a system operating within expected limits.
- Stuck Consumer (Critical) → Consumer is no longer processing messages.
| Pattern | Lag value does not change across checks. |
|---|---|
| Common causes | Crashes, blocked threads, unhandled exceptions. |
| Action | Restart the consumer and review logs. |
- Slow Consumer (Warning) → Consumer processes messages but cannot keep up.
| Pattern | Lag increases steadily. |
|---|---|
| Common causes | Inefficient logic, insufficient resources, slow downstream dependencies. |
| Action | Add consumers or optimize processing. |
- Stable Lag (OK) → Consumer matches the producer’s pace.
| Pattern | Lag stays constant. |
|---|---|
| Common causes | Predictable load where throughput is balanced. |
| Action | None unless the backlog violates latency expectations. |
Monitoring Lag Effectively
Monitoring lag requires more than a single metric; you need data that captures scale, trends over time, and early signs of consumer failures.
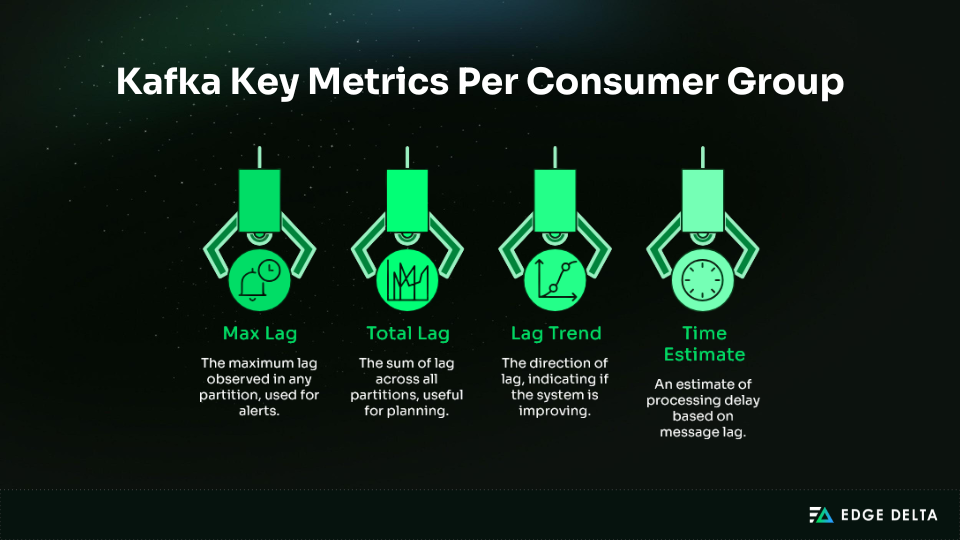
Recommended alert thresholds:
- Warning: Max lag exceeded 100,000 messages for more than 5 minutes.
- Critical: Maximum lag surpasses 500,000 messages, or increases at a rate higher than 50,000 messages per minute.
- Critical: Consumer offset stops advancing for 10 minutes, indicating a possible stall.
Tools for Consumer Lag
Several tools provide quick visibility into consumer lag and help automate alerting:
- Kafka CLI: The fastest way to inspect the offset and lag per partition right from the cluster is by using kafka-consumer-groups.sh. This built-in tool will also display current offsets, log end offsets, and calculated lag for on-the-spot checks.
kafka-consumer-groups.sh \
  --bootstrap-server localhost:9092 \
--describe --group my-consumer-group- Prometheus: Provides automated visibility and alerting when instrumented with Kafka exporters.
- To identify max lag per consumer group
max by (consumergroup) (
kafka_consumergroup_lag{topic="orders"})- To detect consumers with rising lag (5-minute window)
increase(
  kafka_consumergroup_lag[5m]
) > 10000- Datadog: Provides an out-of-the-box Kafka Consumer Lag dashboard, automated alerts for increasing lag, and partition-level issues.
Common Lag Causes & Fixes
The most common lag issues fall into a few predictable categories, each with fairly obvious symptoms and remediation paths.
| Cause | Symptoms | Solution | Time to Fix |
|---|---|---|---|
| Slow processing logic | Steady lag growth | Optimize consumer code | Days to weeks |
| Insufficient consumers | Lag spikes during traffic | Scale consumers horizontally | Minutes |
| Downstream service slow | Intermittent lag spikes | Add retries, timeouts, circuit breakers | Hours to days |
| Network issues | All consumers lagging | Check latency and bandwidth | Minutes to hours |
| Rebalancing | Periodic lag spikes | Tune session timeout and heartbeat settings | Minutes |
| Partition skew | One partition heavily lagging | Improve partition key distribution | Days (repartitioning) |
Implementation Guide (Step-by-Step)
A practical rollout is most effective when it starts with important metrics and alerts, then grow as operational needs mature. This approach keeps complexity low while providing immediate value.
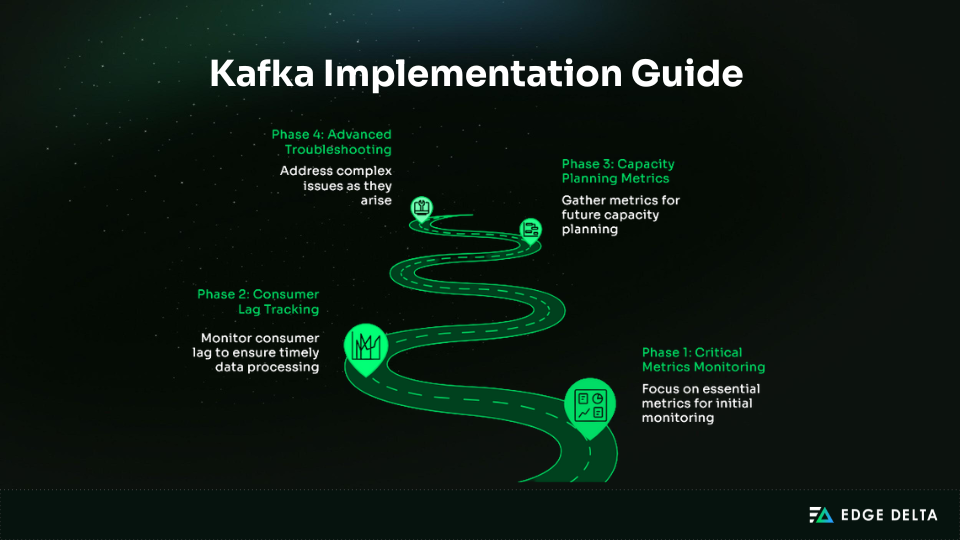
Phase 1: Critical Metrics Monitoring (Week 1)
Establish visibility into the core metrics that surface most Kafka issues:
-
Prometheus + Grafana
- Install JMX Exporter. Attach the JMX agent to each broker to expose metrics.
- Configure Prometheus. Add broker JMX endpoints to the scrape config.
- Import Grafana Dashboard. Start with dashboard ID 7589 and trim to critical metrics.
- Set Basic Alerts. Add alert rules for offline and under-replicated partitions.
-
Datadog
Install the Datadog Agent, enable the Kafka integration, load the pre-built dashboard, and activate recommended monitors.
Phase 2: Consumer Lag Tracking (Week 2)
The goal this week is to make consumer behavior fully observable. Install a Kafka lag exporter so Prometheus can collect per-group lag metrics:
helm install kafka-lag-exporter \
prometheus-community/prometheus-kafka-exporter
If you run Kafka in Docker or on standalone VMs, deploy the exporter as a regular service using its container image or JAR file.
Once lag metrics are available, configure alerts that flag groups falling behind:
- alert: ConsumerLagHigh
  expr: kafka_consumergroup_lag > 100000
  for: 5m
  labels:
    severity: warning
  annotations:
    summary: "Consumer group {{ $labels.consumergroup }} lag >100K"
Phase 3: Capacity Planning Metrics (Month 2)
In this stage, increase your monitoring efforts to determine when the cluster is approaching its resource capacity. Start tracking the following metrics:
- Broker CPU, memory, and disk usage
- Network throughput
- Request rate trends
- Partition distribution
Phase 4: Advanced Troubleshooting (As Needed)
Enable detailed diagnostics only when investigating issues to minimize performance overhead. Focus routine monitoring on key metrics: per-topic and per-partition activity, JVM garbage collection, thread pool utilization, and topic-level disk I/O.
Log Aggregation Strategy
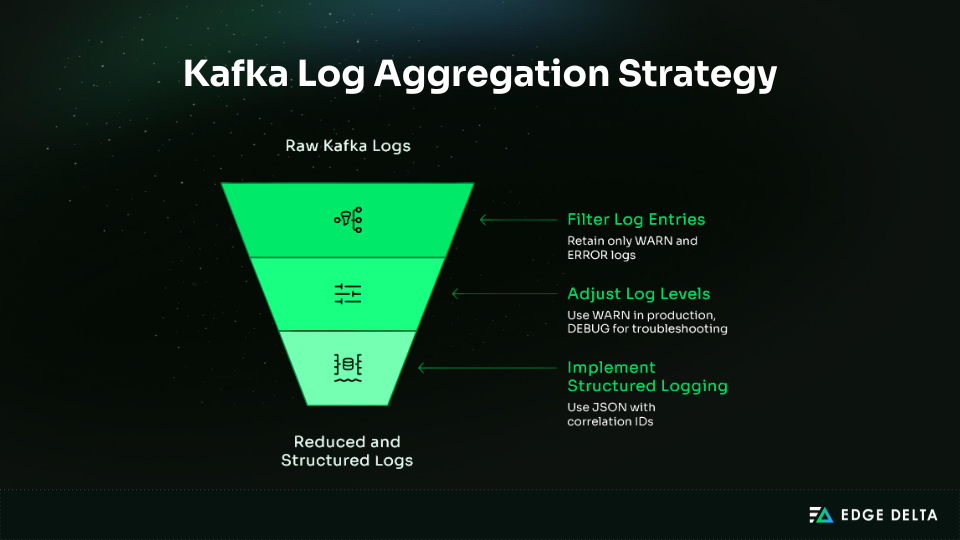
Kafka produces substantial log volume, and storing everything becomes costly fast. For instance, five Kafka generates a high volume of logs, and retaining all of them can quickly become expensive—for example, five brokers may produce over 1.5 TB per month, making log ingestion a major cost factor. Telemetry pipelines can preprocess these logs by extracting valuable signals and filtering out low-value data. Tools like Edge Delta are specifically designed for this purpose, complementing Kafka metrics and monitoring systems rather than replacing them.
Common Kafka Monitoring Pitfalls
This section lists the most frequent mistakes teams make when monitoring Kafka.
Mistake 1: Monitoring Everything (The Cardinality Bomb)
Many teams over-collect metrics, creating a flood of time series that overwhelms storage and analysis.
| Anti-pattern | Monitor lag for every partition of every topic and group. |
|---|---|
| Result | • 100 topics × 10 partitions × 5 groups × 3 metrics = 15,000 time series. • Storage impact: 10GB/day (300GB/month) for consumer lag |
| Right approach | Track max lag per group; drill into partitions only when troubleshooting. |
Mistake 2: Ignoring ISR Shrinkage
Replication problems often start small and go unnoticed, but ignoring early shrinkage can lead to catastrophic data loss.
| Anti-pattern | Only monitor offline partitions. |
|---|---|
| Reality | ISR shrinks unnoticed until the final replica fails. • Day 1: ISR 3 → 2 (no alert) • Day 5: ISR 2 → 1 (still no alert) • Day 7: Final replica fails → data at risk |
| Right approach | Alert on ISR shrinkage and under-replicated partitions. |
Mistake 3: No Consumer Lag Baselines
Static thresholds don’t reflect the reality that lag severity depends on topic throughput.
| Anti-pattern | Alert when lag >10,000 messages. |
|---|---|
| Problem | • Low-throughput topic → minutes behind • High-throughput topic → seconds behind |
| Right approach | Set baselines per group, alert on deviations, and use a time-based lag. |
Mistake 4: JMX Authentication Disabled in Production
Convenience shortcuts in configuration can expose Kafka to serious security risks.
| Anti-pattern | Running with: -Dcom.sun.management.jmxremote.authenticate=false -Dcom.sun.management.jmxremote.ssl=false |
|---|---|
| Risk | Anyone on the network can access or modify Kafka via JMX. |
| Right approach | Enable authentication and SSL despite the complexity. |
Mistake 5: Monitoring Symptoms Not Root Causes
Alerting on latency or throughput spikes catches the effect, not the underlying failure.
| Anti-pattern | Alert on latency >1s. |
|---|---|
| Risk | Latency is a symptom of disk I/O, ISR issues, rebalancing, or network congestion. |
| Right approach | Monitor disk I/O, ISR, and rebalance rates. |
Mistake 6: Alert Fatigue
Too many alerts desensitize teams, making them blind to actual emergencies.
| Anti-pattern | Alert on every broker metric deviation. |
|---|---|
| Result | 50 alerts/day → ignored alerts → missed incidents |
| Right approach | Prioritize alerts: • P0: Page (offline partitions, no active controller) • P1: Slack (under-replication, high lag) • P2: Email (capacity warnings) • P3: Dashboard only (informational) |
Mistake 7: No Runbooks
Without clear guidance, teams waste precious time trying to figure out what an alert means.
| Anti-pattern | Alerts fire with no clear steps. |
|---|---|
| Problem | Response time increases; mistakes multiply. |
| Right approach | Link alerts to runbooks with meaningful causes, steps, resolutions, and escalations. |
Conclusion
Effective Kafka monitoring prioritizes metrics that reveal the system’s actual health instead of capturing every possible signal. Key indicators—such as under-replicated partitions, controller state, and consumer lag—highlight early risks that could lead to outages or data loss. With a clear, focused monitoring plan, Kafka becomes more reliable and less prone to silent failures. To clarify this:
- Focus on what matters most.
- Set baselines and trigger alerts on meaningful changes.
- Avoid high-cardinality data that adds noise without insight.
- Use detailed diagnostics only when investigating.
- Support alerts with clear runbooks and an escalation path.
By following these principles, teams develop a monitoring strategy that minimizes noise and optimizes response times. This approach will also scale reliably with Kafka as workloads increase.
Frequently Asked Questions
What are the most critical Kafka metrics to monitor?
Monitor UnderReplicatedPartitions (data loss risk), OfflinePartitionsCount (partition failure), ActiveControllerCount (must equal 1), Consumer Lag (unprocessed backlog), and ISR Shrink Rate (replication health). Add broker CPU, memory, disk I/O, and request latency. Avoid per‑partition metrics early to reduce storage overhead.
How much does Kafka monitoring cost?
Kafka monitoring usually costs $1.5k-$3k per month. Prometheus and Grafana run $200-$600/month in infrastructure costs, plus setup and maintenance. Datadog costs $1k-$3k/month for 5-20 brokers. Confluent Control Center is $1.5k-$10k+/year. Hidden log aggregation adds $500-$2K/month.
How do I monitor Kafka consumer lag effectively?
Monitor the maximum lag per consumer group and set alerts when it grows significantly or stalls for several minutes. Tools such as Burrow, Prometheus exporters, or Datadog dashboards can help with this. Focus on overall lag trends rather than absolute values, and use time‑based lag in seconds behind.
Why is my Prometheus storage exploding with Kafka metrics?
Each Kafka broker can expose about 100–200 metrics. Storage usage usually increases due to per‑partition monitoring, excessive quantiles, high‑cardinality labels, or very frequent scrapes. To reduce growth: drop verbose metrics with relabeling, aggregate per topic, not per partition, scrape every one to two minutes, and focus on 15–20 critical metrics.
Source List:

