

Kubernetes automates the deployment, scaling, and running of containerized applications. Users may install, administer, and troubleshoot applications on Kubernetes by utilizing the kubectl command-line tool. To help with debugging and problem-solving, users can inspect logs from individual pods with the kubectl logs command.
Kubectl logs and monitoring metrics are crucial for preserving the reliability, efficiency, and health of Kubernetes clusters. Metrics provide a more extensive, quantitative overview of the cluster’s operational state, while logs offer in-depth, real-time insights into application behavior.
This article will provide an in-depth discussion of Kubectl logs and monitoring metrics.
Key Takeaways
• Kubectl logs are crucial for troubleshooting issues with Kubernetes by offering insights into pod and container operations.
• Kubernetes metrics provide an extensive perspective on cluster health and performance, including CPU, memory, and network I/O usage.
• Centralizing logs, using labels and annotations, and creating alerts based on metrics are essential best practices for managing and optimizing Kubernetes environments.
Understanding Kubectl Logs
Kubectl logs are a vital resource for preserving the functionality and health of Kubernetes clusters, facilitating effective administration and prompt problem-solving. Maintaining a healthy Kubernetes system requires understanding and good use of Kubectl logs, as this facilitates proactive monitoring, quick issue resolution, and well-informed decision-making.
Kubectl in a Nutshell
Kubectl is a command-line tool for interacting with Kubernetes clusters and resources via the Kube API. It is pronounced as “kube-CTL,” “kube-cuddle,” or “kube-control.”
To effectively access and handle logs from various pods in your Kubernetes clusters, use the following typical Kubectl logs commands:
| COMMON KUBECTL LOGS COMMANDS | |
|---|---|
| Command | Description |
kubectl logs <pod-name> | Retrieve logs for a specific period |
kubectl logs -f <pod-name> | Stream logs for a specific pod |
kubectl logs <pod-name> --previous | Retrieve logs from a previously terminated container |
kubectl get pods | List every pod currently running in the default namespace |
Kubectl logs -p [pod-name] | Obtain the logs for a previously operational Pod |
Understanding Kubernetes Monitoring Metrics
Metrics for Kubernetes monitoring are crucial in tracking your clusters’ health and efficiency. These measurements offer insights into the cluster’s functioning, helping identify issues and optimize resources. It is crucial for ensuring Kubernetes environments run effectively and safely, enabling continuous application deployment and delivery.
Metric monitoring offers quantitative information on the effectiveness, efficiency, and health of systems and applications running in a Kubernetes environment. Since they allow for ongoing monitoring and analysis of various components, these metrics are essential for preserving the stability and dependability of Kubernetes clusters.
| COMMON KUBERNETES METRICS | |
|---|---|
| Metric | Description |
| CPU Usage | Measures the amount of CPU power being used by pods and nodes |
| Memory Usage | Monitors the amount of memory being consumed |
| Network I/O | Measures the amount of data being sent and received across a network |
| Disk I/O | Monitors data that is written to and read from the disk |
| Pod Status | Provides the pod’s current status |
How to Collect and Analyze Metrics
Collecting and analyzing Kubernetes metrics involves using specialized tools to learn more about your cluster’s health and performance. Metrics are collected, stored, and visualized using Prometheus and Grafana. They offer a powerful combination for tracking and analyzing Kubernetes metrics, facilitating efficient troubleshooting and performance monitoring.
Prometheus and Grafana are two of the most common methods and tools for collecting and analyzing Kubernetes metrics.
- Prometheus: A popular open-source alerting and monitoring toolkit for scalability and reliability. It collects metrics from configured targets at predetermined intervals and saves them in a time-series database.
- Grafana: An open-source visualization tool used to create graphs and dashboards from Prometheus data. It offers visual insights into metrics through a seamless integration with Prometheus.
The next section will cover the best practices for using Kubectl logs and tracking metrics.
Best Practices for Using Kubectl Logs and Monitoring Metrics
Kubernetes clusters’ performance and health depend heavily on efficient logging and monitoring. Monitoring metrics helps track Kubernetes performance and resource usage, while Kubectl logs provide essential insights into pod activities.
Using best practices for logging and monitoring offers organizations the following benefits:
- Issues are quickly identified and addressed
- Optimize resource usage
- Maintain a robust and reliable cluster
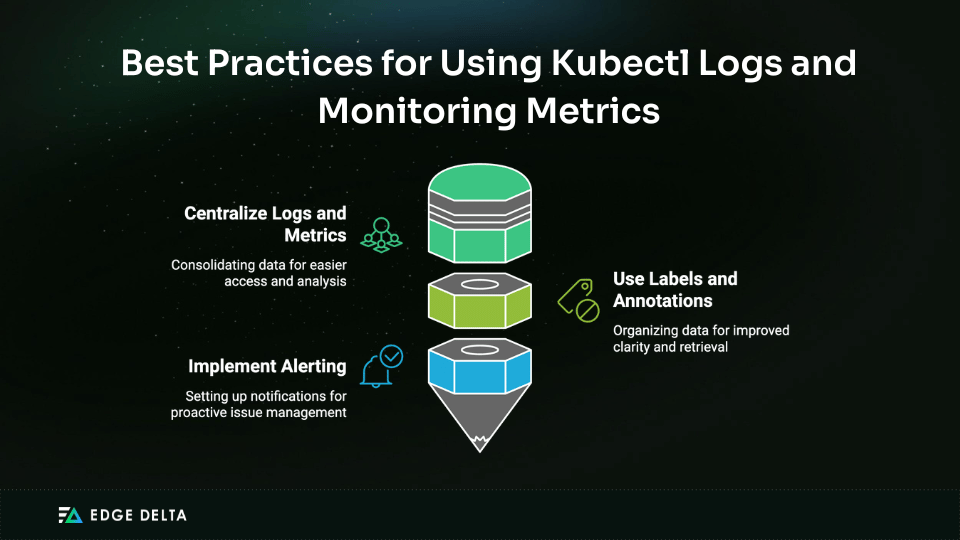
Best Practice 1: Centralize Logs and Metrics
One key best practice for efficient Kubernetes management is centralizing logs and metrics. You can simplify data administration and analysis for your cluster by combining log data and performance indicators from various sources into a single repository. This centralized method increases monitoring and log analysis efficiency, improves visibility, and streamlines troubleshooting.
Best Practice 2: Use Labels and Annotations for Better Organization
Labels and annotations are crucial to organizing logs and metrics in Kubernetes. These components help in categorizing and managing data efficiently, making it easier to filter, search, and analyze logs and metrics based on specific criteria. Both components are key-value pairs used to attach metadata to Kubernetes objects, such as services and pods.
Below are examples of labels and annotations for better organization.
| LABELS AND ANNOTATIONS FOR LOGGING | ||
|---|---|---|
| Resource | Label/Annotation | Purpose |
| Pod | app=web | Identify the application type |
| Namespace | environment=prod | Specify the environment |
| Service | tier=backend | Indicate the service tier |
| Label | app=frontend | Group logs and metrics under the front-end app |
| Annotation | version=v1.2 | Provide more details on the version of the app. |
Best Practice 3: Implement Alerting Based on Metrics
Setting alerts based on specific metrics is crucial for proactive issue detection and resolution in Kubernetes environments. Implementing alerts helps ensure early issue detection, which enables timely intervention before issues escalate. Teams can be alerted to various issues, like excessive resource consumption, malfunctioning pods, or unusual activity, allowing for immediate action and minimizing system downtime.
The challenges and solutions related to using Kubectl logs and tracking metrics will be covered in the next section.
Challenges and Solutions in Using Kubectl Logs and Monitoring Metrics
In Kubernetes deployments, efficiently handling logs and tracking metrics presents a unique set of challenges. Addressing these issues is crucial to maintaining the reliability and effectiveness of Kubernetes deployments.
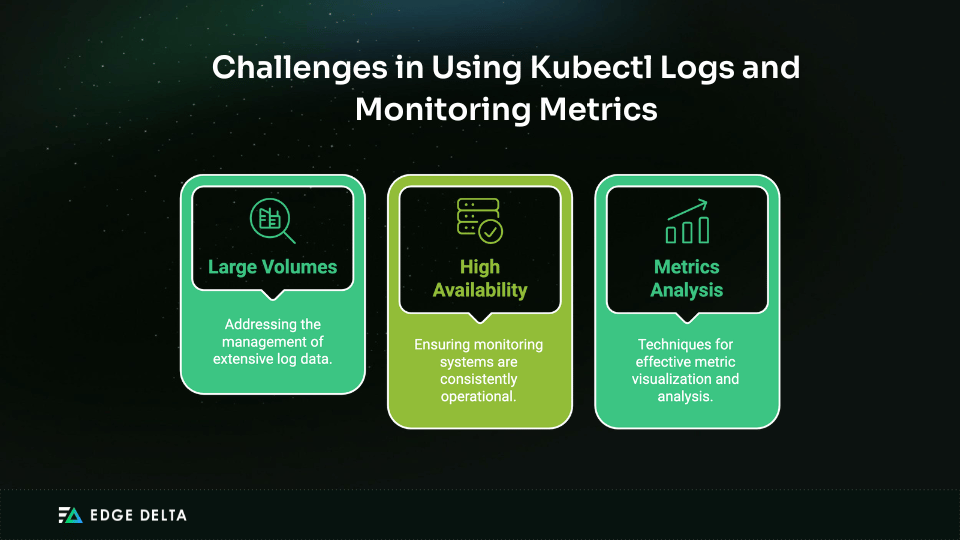
Challenge 1: Handling Large Volumes of Logs
Due to the massive amount of data created, managing huge volumes of logs in Kubernetes can be challenging. High log volumes may cause storage issues, longer processing times, and potential performance deterioration. To keep log data from becoming overwhelming and unmanageable, it is crucial to handle and analyze it efficiently.
Here are some of the best log management tools for handling large log volumes:
| LOG MANAGEMENT TOOLS | |
|---|---|
| Tool | Description |
| Fluentd | Open-source data collector for unified logging |
| Logstash | Server-side data processing pipeline |
| ElasticSearch | Search and analytics engine for log management |
| Kibana | Data visualization tool for Elasticsearch |
| Amazon S3 | A service for scalable object storage |
Challenge 2: Ensuring High Availability and Reliability of Monitoring Systems
High availability and reliability are crucial for monitoring systems in Kubernetes deployments to ensure continued operation and efficient issue detection. Monitoring systems must be resilient to failures and continue to function consistently during outages. Unnoticed major flaws could result in downtime if these systems are not highly reliable.
Challenge 3: Analyzing and Visualizing Metrics Effectively
Analyzing and displaying metrics can be challenging due to the large volume of data collected. The appropriate tools and techniques are needed for effective analysis and visualization to interpret complicated measurements and spot trends and abnormalities. Inadequate visual aids may cause issues to go unnoticed or complicate the process of understanding system operation.
Here are some of the tools for visualizing metrics:
| METRIC VISUALIZATION TOOLS | |
|---|---|
| Tool | Description |
| Grafana | Open-source analytics and monitoring platform |
| Kibana | Visualization tool for Elasticsearch |
| Datadog | Monitoring and analytics platform for cloud apps |
| Prometheus | Collections metrics, using PromQL for querying |
| New Relic | Monitors application performance, creates custom dashboards, and detects anomalies |
Conclusion
Maintaining the stability and effectiveness of Kubernetes clusters requires effective use of Kubectl logs and metrics monitoring. By implementing best practices like proactive alerting and centralized logging, organizations can improve visibility, expedite troubleshooting, and keep Kubernetes infrastructure optimal.
Sources

