


The N+1 query problem occurs when an application issues one database query to retrieve a list of items, then makes an additional query for each item to fetch related data. Instead of retrieving everything at once, the app makes one query, then N more. This pattern creates unnecessary load on the database and slows down your application.
The N+1 query problem might not raise red flags right away. Over time, though, it starts to chip away at your app’s performance. Pages take longer to load, logs fill up with the same repeated queries, and it gets harder to figure out what’s actually causing the slowdown.
So, how do you fix it? How can distributed tracing help solve the N+1 query problem?
Distributed tracing gives developers a clear view of how requests move through services and databases. It helps you spot where queries are being repeated, where the code could be more efficient, and whether your changes are actually making things better.
In the next section, we will break down how distributed tracing works and how it helps resolve the N+1 issue step by step.
Why N+1 Queries Matter and How Distributed Tracing Helps
The N+1 query problem occurs when applications — such as those built with Django, Rails, or Hibernate — make one query and then repeat similar ones in a loop. For example, fetching blog posts and then querying each author separately. This inefficiency often occurs in SQL-based Object-Relational Mapping (ORM) frameworks and slows down performance.
N+1 queries may seem harmless at first, but they quietly drain performance and resources in several ways:
- Creating unnecessary database overhead and latency
- Increasing server load with repeated queries
- Wasting compute resources on avoidable operations
- Making performance issues harder to debug and trace
To effectively address the N+1 query problem, you need a way to visualize how data flows through your system. That’s where distributed tracing comes in.
Distributed tracing tracks requests as they pass through services, APIs, and databases. It provides developers with comprehensive visibility into the full request lifecycle, illustrating how each component of the system responds. This kind of visibility helps you identify where slowdowns are occurring, spot patterns that aren’t working well, and pinpoint precisely where issues like N+1 queries are arising.
Now that we’ve covered what distributed tracing does, let’s see how it helps fix N+1 problems in real-world apps.
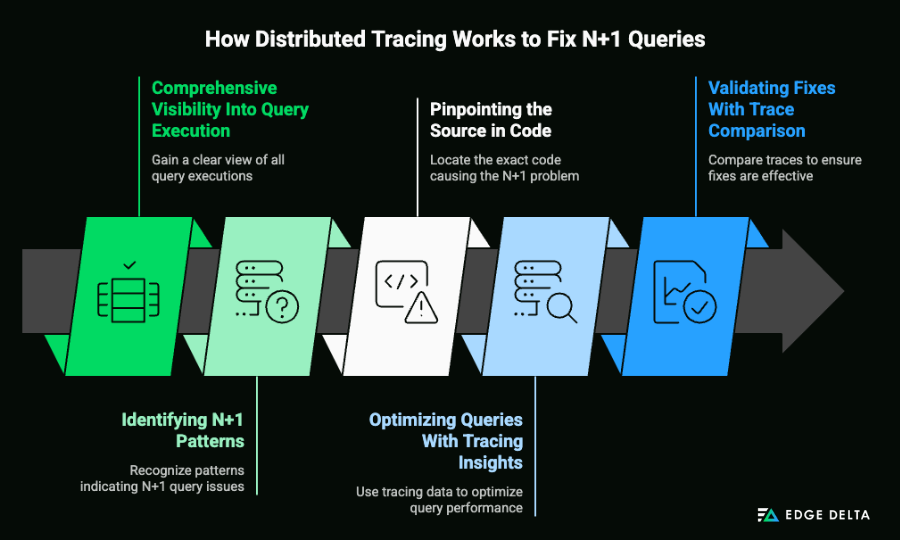
1. Comprehensive Visibility Into Query Execution
The first step in solving the N+1 query problem is to clearly understand it. Distributed tracing provides that clarity by offering a comprehensive view of how each request flows through your system, from the frontend to backend services and down to the database level.
With tracing in place, each request is tagged and tracked across your architecture. This gives you complete visibility into:
- Which services handle the request
- How long does each component take to respond
- What database queries are triggered along the way
- Where duplicate or unnecessary queries occur
This visibility is essential for identifying inefficient query patterns, such as N+1. In many cases, an app may appear to be running smoothly on the surface. However, the traces will reveal:
- A single request generates dozens of repeated database calls.
- Nested ORM loops trigger extra queries for each related object.
- Unbatched requests that could be grouped into a single call
By leveraging traces to detect query patterns, developers gain the context they need to debug smarter. Whether the problem originates in a specific service, a sluggish route, or a quiet ORM call, distributed tracing brings it to light, allowing you to take action.
2. Identifying N+1 Patterns
Once distributed tracing is in place, the next step is to utilize it to identify the specific query patterns that indicate an N+1 issue. These patterns can be tricky because they often hide in code that looks like it’s working just fine, especially when you’re using ORMs like Django, Rails, or Hibernate.
A common example is when you fetch a list of parent items, and then the app quietly runs a separate query for each related item. If you’re using nested loops or relying on automatic ORM behavior, this can happen without you even realizing it.
With distributed tracing, you can spot these inefficient patterns more easily by analyzing the trace data. You might see something like:
- One incoming request to view a list of items
- A spike in identical or similar queries being made immediately afterward
- Long chains of repeated SELECT statements for related data
These clues strongly suggest that your application is making repeated queries for each item, instead of batching them or using more efficient methods, such as joins or eager loading.
Tracing tools such as Jaeger, OpenTelemetry, or Edge Delta provide visualizations and timelines that help highlight this behavior. They make it easy to drill into a trace and see precisely when and where each query is executed.
Catching the N+1 pattern allows you to clean up your code before it begins to slow things down.
3. Pinpointing the Source in Code
Once you spot the issue in your traces, the next step is figuring out exactly where it’s coming from in your codebase. One of the most significant advantages of distributed tracing is that it directly connects performance issues to the part of the application that causes them.
Instead of just knowing that a query is inefficient, you can see:
- Which service triggered the request
- What function or route was involved
- The specific ORM call or data access pattern that caused the repetition
For example, you might discover that a list view in your Django or Rails app is using lazy loading by default. That could be causing a new database call every time it loops through related objects. Or you might find that a SQL query is being run inside a loop without batching, even though the data could have been retrieved in a single request.
With this kind of insight, developers don’t have to guess. They can go straight to the part of the code causing the issue, whether that means adding eager loading, tweaking a model relationship, or fixing a loop. It takes the guesswork out of debugging and makes it easier to fine-tune your app’s performance.
4. Optimizing Queries With Tracing Insights
Once you’ve identified where the N+1 problem originates, it’s time to optimize the queries. Distributed tracing doesn’t just help you find the issue; it also helps you understand the root cause. It also guides your next steps by showing exactly how the application behaves before and after your changes.
Here are some of the most effective ways to eliminate N+1 queries:
Batch queries whenever possible
Instead of sending a new query for each object, batch them into a single request. For example, retrieve all related records using a single WHERE IN clause. This cuts down the number of database calls and improves response time.
Use JOINs or eager loading
Most Object-Relational Mappers (ORMs) support eager loading to fetch related data in a single operation. In SQL, this is similar to writing a JOIN that pulls in all necessary information upfront. This prevents your app from making separate queries for every relationship.
Integrate data loaders or caching
Data loaders group requests during the same execution cycle and resolve them in a single query. They work exceptionally well with GraphQL or systems prone to repeated lookups. Caching is another effective way to reduce the number of repeated queries. By storing frequently accessed data, you can avoid the extra trips to the database.
Tracing helps you see the difference as you apply these fixes. You’ll know right away if your changes are working and if things are running more efficiently.
5. Validating Fixes With Trace Comparison
Once you’ve cleaned up your queries, it’s essential to verify if the changes have improved things. With distributed tracing, you can look at traces from before and after the fix to see if the N+1 issue is gone.
Start by reviewing key metrics in your traces, such as:
- The number of database queries triggered by a single request
- The time it takes for those queries to complete
- The overall response time for the full request path
If your changes were effective, you should see fewer redundant queries and shorter execution times. The traces should show that the database is being accessed more efficiently, with related data loaded in fewer steps.
Tools like Edge Delta provide real-time visualizations and metrics to make this validation process much easier. You can spot improvements quickly and catch any regressions before they impact users.
By continuously monitoring and comparing trace data, you can ensure that N+1 problems stay fixed and don’t return as your application evolves.
Best Practices for Using Distributed Tracing to Solve N+1
Solving N+1 query problems isn’t just about fixing one issue. It’s about establishing habits and systems that prevent these patterns from recurring. Here are a few best practices to get the most out of distributed tracing when addressing N+1 behavior:
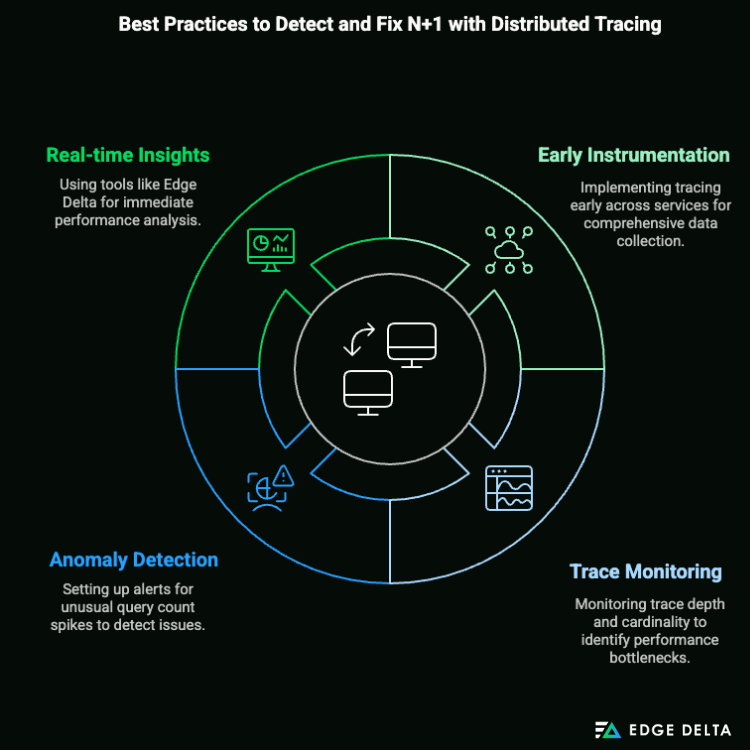
Instrument early and across services
Ensure that distributed tracing is integrated throughout your entire architecture, not just in a single service. Early instrumentation helps you catch inefficient patterns before they grow into more significant issues.
Monitor trace depth and cardinality
Deep traces with numerous spans can be a sign of unnecessary complexity. High-cardinality data can also affect performance and cost. Closely watching these metrics can help you spot signs of N+1 issues before they start to slow things down.
Set up anomaly detection for spikes in query count
If your app suddenly starts making more queries per request, it could be an early warning sign of an N+1 regression. Use thresholds or automated alerts to catch this behavior in real time.
Use Edge Delta or similar tools for real-time insights
Observability platforms like Edge Delta provide a live view into logs, metrics, and traces. It helps you catch performance issues early, so you can fix them before they grow into something bigger.
Final Thoughts
The N+1 query problem might seem small at first, but it can quietly slow your app down, strain your database, and make things harder to scale. If it goes unnoticed, it can lead to a frustrating experience for both users and developers.
Distributed tracing helps you spot these patterns early and figure out exactly where they’re coming from. With better visibility into how your app behaves, you can clean up inefficient queries, speed things up, and make sure the changes you’ve made are actually working.
The key is not just solving the issue once, but also continuously monitoring to ensure it doesn’t recur. That’s where tools like Edge Delta can make a real difference, offering real-time observability, faster debugging, and proactive alerting when something goes off track.
FAQs
What is the N+1 query problem in Django or Rails?
It’s a common performance issue where the app makes one query to fetch items, then additional queries for each related object. ORMs like Django and Rails can trigger this when using lazy loading or nested loops.
How does distributed tracing identify the N+1 pattern?
Distributed tracing tracks each request across your system and highlights repeated database calls. By reviewing trace timelines, developers can identify identical queries occurring in sequence, a key indicator of an N+1 pattern.
How do you solve N+1 problems in SQL or Hibernate?
In SQL, you can use JOINs to retrieve related data in a single query. In Hibernate, switching from lazy to eager loading or using batch fetching strategies can prevent repeated calls for related objects.
Can you use distributed tracing with GraphQL or ORMs?
Yes. Distributed tracing works well with GraphQL and Object-Relational Mapping (ORM) by showing how queries are constructed and executed. Tools like OpenTelemetry and Edge Delta help visualize and optimize these request flows.

