


Observability, at a high level, is understanding a system’s internal workings through its various outputs. In the context of observability, there are three fundamental output types: metrics, logs, and traces.
The three outputs provide a comprehensive view for monitoring, troubleshooting, and optimizing complex systems. Each output type is different, offering unique insights into the health and performance of systems and applications, and traces are no different – they play a critical role in this process.
So, what are traces? Traces are a type of data that captures requests as they flow through a system, capturing key steps across services and components. They help identify errors, slowdowns, and bottlenecks, allowing IT teams to resolve problems quickly and optimize performance.
This article explores what traces are in observability, their significance, and their practical applications.
Key Takeaways* Traces in observability track service interactions as they occur to identify errors, latency problems, and bottlenecks, for overall enhancement of the user experience. * End-to-end telemetry data solutions like Edge Delta are crucial for efficiently extracting insights from trace data. * In e-commerce, tracing involves verifying user credentials, obtaining product data, managing shopping carts and item availability, and managing inventory details.- Adapt to system changes by ensuring consistent instrumentation, using distributed tracing tools, integrating with existing monitoring systems, and continuously improving tracing practices.
The Role of Traces in Observability
Traces map dependencies and performance by following a request’s path through a distributed system. They are built of individual spans that track information about a segment of the entire collection of interactions and are related through parent-child relationships and trace IDs.
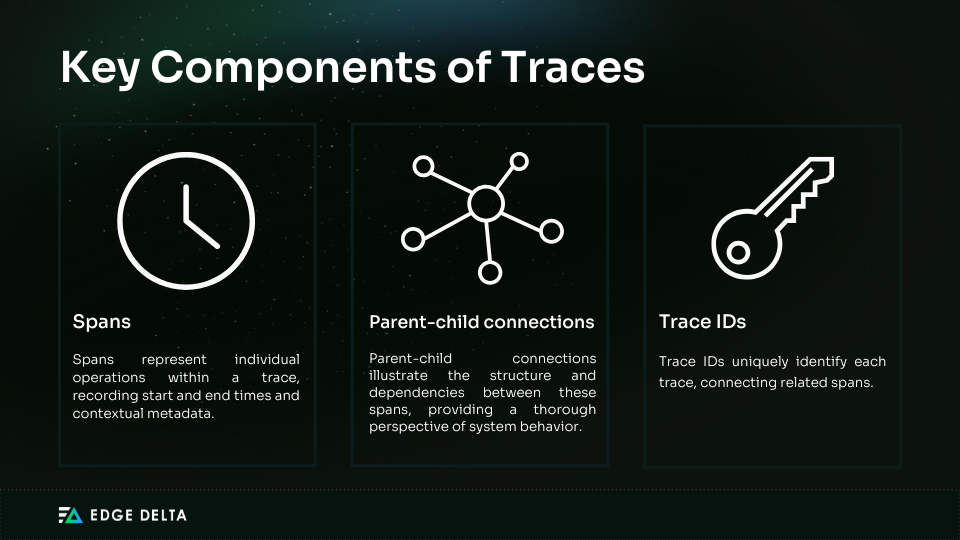
Traces offer thorough insights into system activity, which helps locate problems, bottlenecks, and overall system flow.
How Do Traces Work?
Traces work by tracking the movement of requests through a system and recording each step as a span with a distinct trace ID and timestamp. This method involves the following:
- Generating trace data during each service interaction
- Collecting data via distributed tracing systems
- Analyzing data to identify errors, bottlenecks, and performance issues
The Importance of Traces in Observability
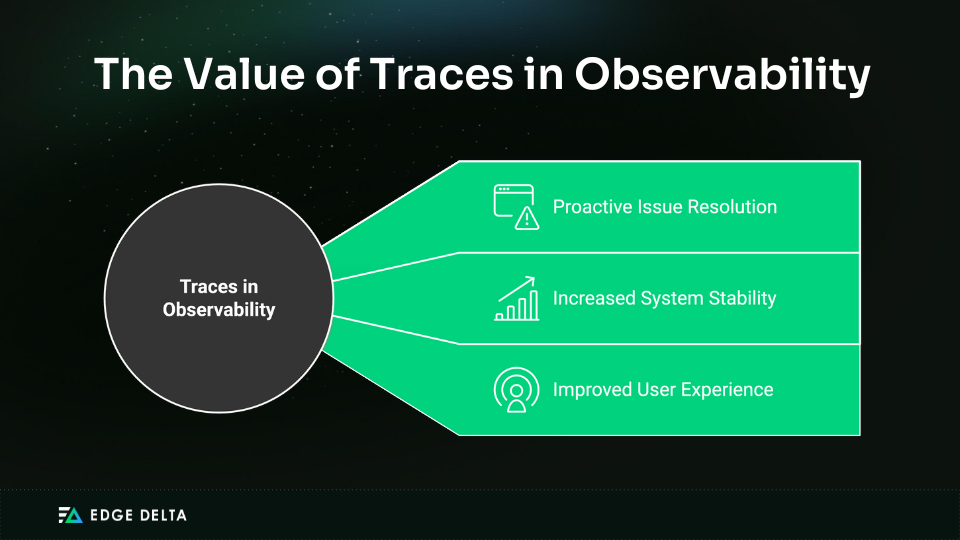
Traces are crucial for observability, offering comprehensive insights into the movement of requests across complex systems. By mapping out service interactions, traces help detect errors, identify performance bottlenecks, and understand system interdependence. This detailed visibility enables:
- proactive issue resolution
- increased system stability
- an improved user experience
Here are four reasons why traces are vital for observability:
1. Performance Monitoring
Traces help monitor the distributed system’s effectiveness by providing detailed insight into how requests flow across different services. In this way, traces help identify the source of delay points and bottlenecks in the system.
Such insight helps the IT, DevOps, and SRE teams to respond effectively to performance challenges. They optimize system operations and address inefficiencies to get the system to run while providing a smooth user experience.
2. Debugging and Troubleshooting
Traces are extremely helpful in debugging and troubleshooting complex networks by giving the details of various interactions in an entire system. They help in identifying issues like:
- Misconfigurations
- Failed service calls
- Latency spikes
For example, traces might point out specific database queries that take a long time to execute, thus representing a performance bottleneck or a failing microservice that breaks the workflow.
3. Dependency Analysis
Traces provide visibility. They identify a problem, chart dependencies, and help in identifying the root of the problem. All of which are important in diagnosing issues, managing performance, and ensuring stability in modern IT architecture.
4. User Experience Improvement
Teams can proactively manage and improve user experience through trace analysis, which helps in:
- Identifying performance bottlenecks
- Fixing errors
- Prioritizing optimizations
- Validating changes
Traces highlight the sequence of events in which a request passes through the system, showing points where delays or errors occur. This proactive approach provides smoother interactions and faster response times.
Key Concepts in Tracing
Key concepts like spans, trace context, sampling, and instrumentation are essential for facilitating efficient tracing procedures, which ensure that teams can:
- Identify issues
- Optimize efficiency
- Improve the reliability of their applications
Below is a brief description of the importance of key concepts in tracing.
| Key Concept | Description | Importance |
|---|---|---|
| Span | A unit of work that represents an event or operation in a distributed system. | Keeps track of activities and offers insight into how the system behaves. |
| Trace Context | Metadata that keeps trace continuity by traveling with requests between services. | Ensures that requests can be correlated and tracked from the start to the end. |
| Sampling | Determines which traces to keep track of while managing trace data. | Balances the overhead of data collection and storage with detailed tracing. |
| Instrumentation | Incorporates tracing mechanisms into code to capture trace data. | Permits the collection of traces and performance metrics for observability. |
Examples of Tracing in a Real-world Application
Here’s a simple scenario to illustrate a client-server application scenario:
A client delivers a request, which the server processes and responds to. Every interaction is recorded as a span inside a trace context, starting with the client’s request and ending with the server’s response.
For example, when the client delivers the request:
(Trace Context: customerrequest1, SpanID: 1, timestamp: X)The server receives it:
(SpanID: 2, timestamp: Y)Then, the server subsequently processes it:
(SpanID: 3, timestamp: Z)The trace context connects these spans, showing their relationship within the same transaction. Distributed tracing tools combine these spans into visual representations that can be accessed through an online interface or alerting and AIOps systems.
The following section will cover how each span contributes to understanding the request flow.
Step-by-Step Trace Analysis
The step-by-step analysis examines a request’s sequence to optimize system behavior. These steps include identifying, collecting, evaluating, and validating data. Here’s a step-by-step analysis of a trace within the framework of a microservices-based e-commerce application:
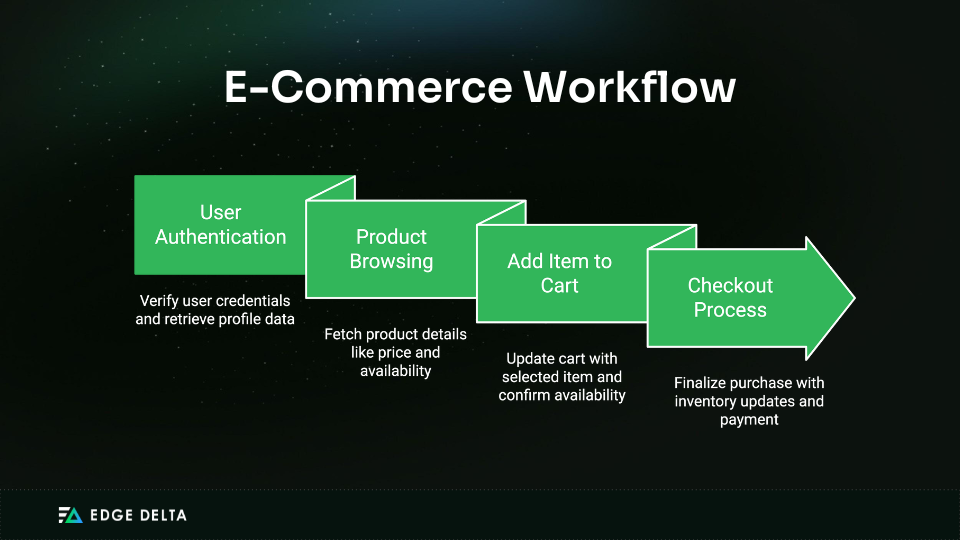
- User Service (User Authentication)
- Span: Verification
- Role: Retrieves user profile data and verifies user credentials.
- Contribution: Identifies the user and sets their degree of authorization for upcoming communications.
- Product Browsing (Product Service)
- Span: Product Catalog Obtaining
- Role: Retrieves product information, such as cost and availability.
- Contribution: Gives the user current details on the product they’ve selected.
- Add Item to Cart (Cart Services)
- Span: Include in Cart Function
- Role: Oversees the user’s shopping cart, updating quantities and verifying availability.
- Contribution: Guarantees that the chosen item is correctly added to the cart while providing up-to-date availability information.
- Checkout Process (Order Service)
- Span: The Process of Checkout
- Role: Manages inventory updates, order creation, and payment processing.
- Contribution: Arrange for the user’s purchase to be completed, ensuring that all required steps (payment authorization, inventory deduction) are finished.
Identifying and Resolving Issues
Trace data not only reveals dependencies and errors but can also provide key system performance metrics. It establishes a panoramic view of microservice interactions. With this information, developers may find issues that they can prioritize fixing to enhance system functionality and reliability.
Through continuous monitoring and optimization, this proactive approach not only resolves current problems but also helps prevent future ones, improving overall user experience.
Identifying and resolving performance or reliability issues in complex systems, such as microservices design, depends heavily on trace data. Here’s an excellent way to use trace data:
Detection of Performance Bottlenecks:
- Issue: During peak hours, a microservice that handles payments occasionally has slow response times.
- Analysis: Experts examine traces associated with the payment processing service. They locate spans with extended durations, which could be signs of bottlenecks.
- Solution: IT teams identify the underlying problem and modify the microservice code to reduce query processing times or implement caching techniques. Response times are shortened, and system performance improves overall.
Best Practices for Using Traces
Following best practices for using traces enables organizations to enhance user experiences, optimize performance, improve troubleshooting, and gain insights into system behavior.
Here is a table representing the best practices for using traces:
| BEST PRACTICES FOR USING TRACES | |
|---|---|
| Best Practice | Description |
| Consistent Instrumentation | Ensure each component is instrumented similarly to collect consistent trace data throughout the system. |
| Choosing the Right Tooling | Select tracing tools that enable the necessary functionality and align with the system’s architecture. |
| Analyzing Trace Data | Integrate trace data with logs, metrics, and other observability data to provide a thorough understanding of the system’s behavior and performance. |
| Integrating with Monitoring Systems | Consolidate observability efforts and simplify operations by integrating tracing with existing platforms and tools for monitoring. |
| Continuous Improvement | Review and enhance tracing practices regularly to optimize performance monitoring, effectively troubleshoot problems, and adjust to changing system needs. |
Consistent Instrumentation
In distributed architectures, comprehensive tracing relies on uniform instrumentation across all system components. This ensures consistent trace data collection from databases, external services, and microservices, enabling end-to-end visibility.
Consistent trace data is crucial for efficient troubleshooting and root cause analysis during incidents. It also fosters better collaboration between development and operations teams.
Uniform instrumentation also ensures systems retain observability as they expand and change by supporting scalability and future-proofing tracing capabilities. Additionally, by correlating associated logs and metrics with traces, teams get deeper insight into system behavior and can pinpoint issues much faster. Overall, this consistent approach to instrumentation promotes a greater user experience, increases operational efficiency, and strengthens system reliability.
Choosing the Right Tools
The following criteria should be taken into account while selecting tracing tools and frameworks for your system:
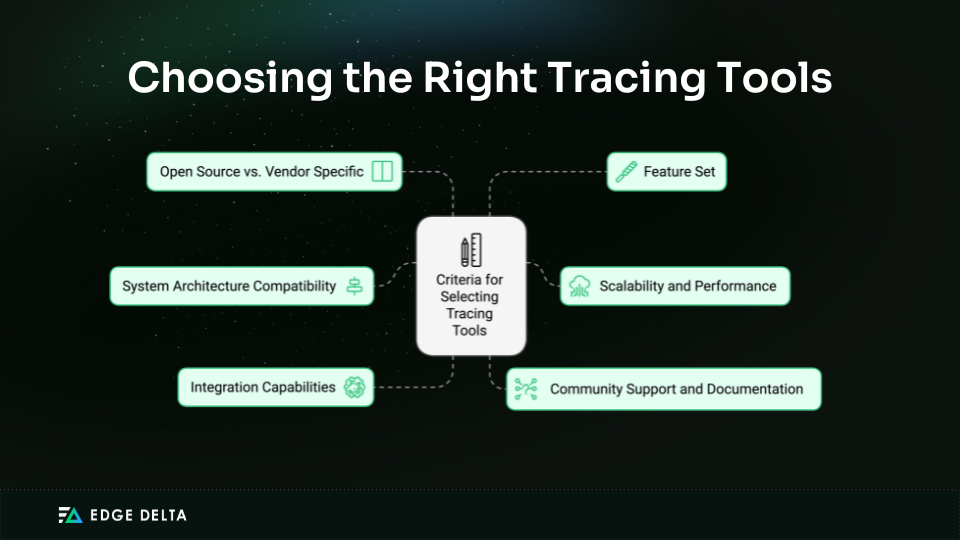
- System Architecture Compatibility: Choose tools that complement your system’s design and technology stack. Tools like Jaeger, Zipkin, and OpenTelemetry support various programming languages and can be used in monolithic and microservice-based systems.
- Scalability and Performance: Assess how scalable the solution is for managing the trace data your applications create. Large-scale installations are best suited for tools like Jaeger and OpenTelemetry, which enable distributed tracing and horizontal growth.
- Integration Capabilities: Select tools that work well with the monitoring and observability stack you already have. Look for support for common integrations. Seek assistance with alerting tools, logging frameworks, and monitoring systems.
- Community Support and Documentation: Opt for tools with extensive documentation and active community support. Tools such as Jaeger and OpenTelemetry have robust communities contributing to continued development.
- Open Source vs. Vendor Specific: Consider whether an open-source or vendor-specific solution better suits your needs. Open-source tools like Zipkin and Jaeger provide flexibility and transparency, but vendor-specific solutions could offer more functionality and support but might have license fees.
- Feature Set: Evaluate the tool’s feature set, such as support for advanced features like context propagation, adaptive sampling, and analytics capabilities. OpenTelemetry provides a standardized approach to instrumentation and tracing, enhancing interoperability and simplicity of adoption across various settings.
Analyzing Trace Data
Effective trace data analysis is essential to understanding distributed systems’ behavior and performance. Following these best practices allows organizations to effectively detect performance issues, optimize systems, and improve user experience and reliability in distributed environments.
The following are the best practices for examining trace data:
- Correlating Traces with Other Observability Data: Logs offer comprehensive event information (e.g., application logs, error messages), whereas metrics provide aggregated numerical data (e.g., CPU use and request rates).
You can determine correlations between system events and performance issues by linking traces with metrics and logs. This also helps contextualize trace spans within broader framework activities.
- Utilizing Distributed Tracing Tools: Use tools that facilitate the collection, processing, and visualization of trace data across distributed settings like Edge Delta. IT teams may use these tools to investigate trace spans visually, examine dependencies, and identify latency bottlenecks that traverse service boundaries.
- Identifying Latency Bottlenecks: Find latency bottlenecks by inspecting spans within traces. A longer length or a higher latency value in a span may indicate a performance issue impacting the user experience. By deepening certain spans and learning about their dependencies, you will identify and rank areas for improvement.
- Applying Contextual Filters: Use tags and filters to track down data and narrow down analysis on specific endpoints, services, or valuable transactions. Filtering on features such as error codes, operation names, or service names can reduce noise during analysis and concentrate on relevant traces.
- Correlating Trace Data Over Time: Examine trace data to spot patterns and trends in the system’s behavior. Compare current traces with historical data to detect improvements or declines in performance. This analysis shows how well infrastructure modifications and optimizations work over time.
- Collaboration Across Teams: Share trace data insights to encourage cooperation between the development, operations, and business teams. With collaborative analysis, priorities can be aligned, user effects can be understood, and well-informed decisions can be made for system enhancements.
- Automating Analysis and Alerting: Activate automated alerting and analysis systems triggered by anomalies or thresholds set and found in trace data. Automated alerts enable proactive monitoring and prompt resolution of performance problems before they affect users.
An SRE Teammate extends this automation by not just alerting on trace anomalies, but actively investigating them — correlating spans across services to identify root cause without requiring manual analysis.
Integrating with Monitoring Systems
Connecting tracing tools with your existing monitoring and observability systems gives you a complete view of your system’s health. This unified perspective helps teams stay ahead of performance issues, improve application reliability, and enhance user experiences.
By adopting this holistic approach, organizations can make flexible, data-driven decisions while boosting operational efficiency across their teams.
Continuous Improvement
Tracing needs to evolve alongside your system to remain effective. Focusing on adaptable strategies ensures that your tracing processes stay robust, efficient, and aligned with your organization’s ever-changing needs.
Conclusion
Traces are essential to modern observability. They offer detailed insights into request flows and system performance. They help monitor performance, diagnose issues, analyze dependencies, and improve user experiences.
As systems grow more complex, effective tracing becomes essential for keeping everything running smoothly. Strong tracing practices not only boost reliability and operational efficiency but also enhance user satisfaction, setting businesses up for long-term success in an ever-changing IT landscape. Edge Delta’s SRE Teammate works directly with trace data — correlating spans with logs and metrics to automatically surface the root cause of performance issues.
FAQs on Traces in Observability
What are traces in observability?
Traces are a type of data that capture requests as they flow through a system, capturing key steps across services and components.
What is the difference between metrics and traces?
Metrics provide performance insights by quantifying the system’s health. Traces help identify problems by identifying bottlenecks and relationships between system components. When combined, metrics and traces provide a thorough framework for observability.
What are the three components of observability?
The three pillars of observability consist of traces, metrics, and logs.
Sources

