


OpenTelemetry is an open-source observability framework for cloud-native software. It provides tools for collecting and exporting telemetry data from applications and infrastructure.
Traces are a critical piece of telemetry data, which give users insight into how requests are traveling through their system. OpenTelemetry Tracing is OpenTelemetry’s standard for managing trace data. OpenTelemetry Tracing is a standard for instrumenting application code.
With this function, you can get context on every request’s source, destination, status, and journey, which is the key to improving your application’s performance, reliability, and observability.
Continue reading to more deeply understand what OpenTelemetry Tracing is: The underlying process, its key benefits, and how it can help you instrument your systems to run more smoothly.
Key Takeaways
- OpenTelemetry Tracing lets users track a request as it travels through their system, more specifically tracking information like source, destination, status, and journey for monitoring and analysis.
- OpenTelemetry Tracing provides end-to-end visibility into the flow of requests and transactions in distributed systems.
- Users can leverage OpenTelemetry and its associated functions to improve microservices monitoring, performance optimization, root cause analysis, and more.
- OpenTelemetry was the result of a merge between OpenTracing and OpenCensus. As a result, OpenTracing offers both frameworks’ functions and features.
How Does OpenTelemetry Tracing Work?
OpenTelemetry Tracing captures trace data from applications, processes it, and exports it to backend systems for analysis. In general, this framework has two core concepts: traces and spans.
OpenTelemetry Span vs Trace
A trace provides the end-to-end workflow of a request being made. Each trace has a series of interconnected spans representing an individual operation/activity within a service/component. Spans can be nested to form a trace tree.
Below is an OpenTelemetry span example:
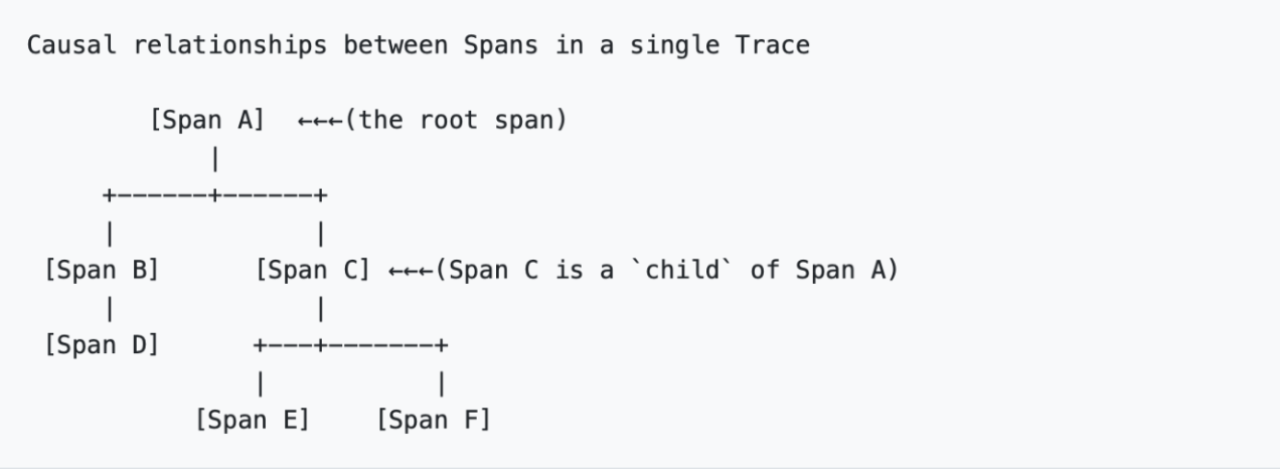
Source: Opentelemetry.io
The OpenTelemetry architecture involves many components, including:
- Receivers, to collect data from various sources.
- Optional Processors, to process data collected by receivers.
- Exporters, to transmit processed data and send it to the chosen backend.
which are the main architectural OpenTelemetry building blocks.
Another key piece of this architecture is the OpenTelemetry Collector. the OTel collector is a part of the data collection pipeline which receives telemetry data and sends it to any configured backend.
Here’s an OpenTelemetry Collector example in a pipeline:
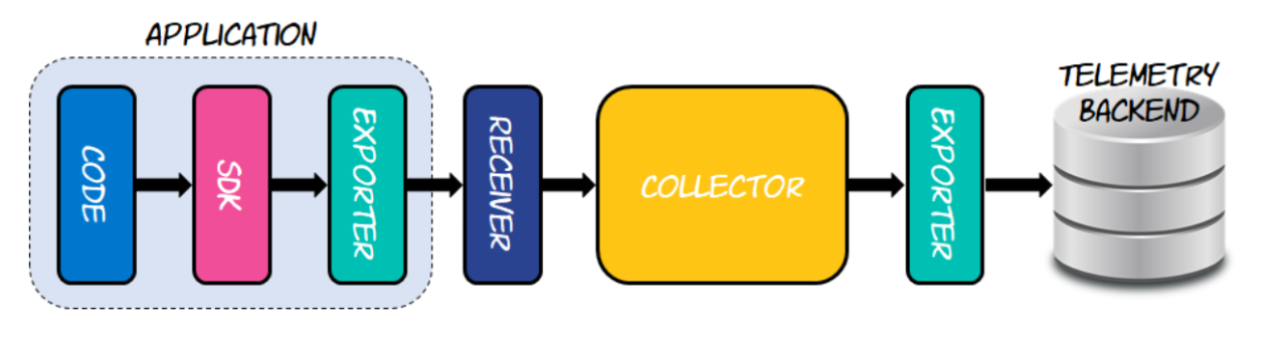
Source: Elastic
OpenTelemetry Tracing Process
OpenTelemetry tracing involves collecting data on requests as they propagate through individual services, components, and functions. It gives visibility into performance bottlenecks, latency issues, and errors. Instrumenting your code with OpenTelemetry tracing allows you to collect trace data from your applications as they are created.
As a request traverses the system, spans (a unit of work) are created to track operation executions. Then, spans are correlated with each other and assembled into a trace through context propagation. When the spans have been populated with relevant data, they are exported to a tracing backend for storage and analysis.
Refer to the data below for OpenTelemetry tracing examples:
Instrumenting the Code
The first step to implementing OpenTelemetry tracing is initializing a TracerProvider, which in turn will generate a Tracer.
The code snippet below incorporates the necessary OpenTelemetry API import and gets the default TracerProvider.
import io.opentelemetry.api.trace.*;
TracerProvider tracerProvider = TracerProvider.getDefault();
Tracer tracer = tracerProvider.get("instrumentation-library-name","semver:1.0.0");
The TracerProvider initiates the received Tracer and specifies the instrumentation library name and semantic version.
Note
Utilize the OpenTelemetry SDK created for the language you are working with, to instrument traces into your code.
The next step is to create spans for tracing operation executions in your application.
Generating Spans
The OpenTelemetry SDK simplifies the span generation process, as it handles the beginning and end of spans created by your application. Here is how to create and activate a span:
Span span = tracer.spanBuilder("span 1").startSpan();
// Set this span as the current span
try (Scope ss = span.makeCurrent()) {
	// your application code goes here
} finally {
   span.end();
}
We have created a span called span 1, made it the current active span within its scope, and then ended it after executing the relevant application code in the try block.
The next step is to create parent-child span relationships, by nesting spans within each other, which allows you to trace the hierarchy and flow of steps within operation steps.
Span parentSpan = tracer.spanBuilder("parentOperation").startSpan();
try (Scope parentScope = parentSpan.makeCurrent()) {
  // your application code here
  Span childSpan = tracer.spanBuilder("childOperation").startSpan();
  try (Scope childScope = childSpan.makeCurrent()) {
    // your application code here
  } finally {
    childSpan.end();
  }
} finally {
  parentSpan.end();
}
In the example above, we created the parentOperation span, and within its scope created the childOperation span. With this structure, different code can be associated with individual or multiple spans, giving you more information into the internal behavior of your code. The child span is explicitly linked to the parent span through context propagation.
When creating spans, you can also add or modify span attributes to enrich your telemetry data with additional context.
Span span = tracer.spanBuilder("operationName").startSpan();
try (Scope scope = span.makeCurrent()) {
  span.setAttribute("myAttribute", "myValue");
  // your application code here
} finally {
  span.end();
}
Here, we are using the setAttribute function, which assigns a new myAttribute attribute with a new myValue value to the span.
Note that attributes have rules that each programming language SDK implements:
- Keys must be non-null string values.
- Values must be a non-null string, boolean, floating point value, integer, or an array of these values.
Context Propagation
Context propagation is the passing of essential trace and span contexts between different parts of a distributed application. It ensures traces maintain continuity across distributed systems. Below is an example of context propagation. Remember that you’ll need to define the Scope and extractedContext classes and add relevant import statements for this to work.
TextMapPropagator.Getter getter =
  new TextMapPropagator.Getter() {
    @Override
    public String get(HttpRequest carrier, String key) {
      return carrier.getHeader(key);
    }
  };


Context extractedContext = OpenTelemetry.getPropagators()
  .getTextMapPropagator()
  .extract(Context.current(), request, getter);
try (Scope scope = extractedContext.makeCurrent()) {
// your application code here
}We are first create a getter method Getter to extract values from an HttpRequest. The extracted context is then made changed to the current context in the extractedContext object. Once set up, the trace context is carried across service boundaries.
Exporting Data
OpenTelemetry sends collected data to any backend (Jaeger, Zipkin, etc.) for further analysis and visualization. This lets you gain actionable insights into system behavior, troubleshoot issues, and optimize performance.
Setting up OpenTelemetry to export traces begins by writing configurations to collect and export data within the OpenTelemetry Collector.
Create a file config.yaml: with the following content:
receivers:
  otlp:
    protocols:
      grpc:
        endpoint: 0.0.0.0:4317
      http:
        endpoint: 0.0.0.0:4318
exporters:
  debug:
    verbosity: detailed
service:
  pipelines:
    traces:
      receivers: [otlp]
      exporters: [debug]
    metrics:
      receivers: [otlp]
      exporters: [debug]
    logs:
      receivers: [otlp]
      exporters: [debug]
This configuration enables you to set up OpenTelemetry with the OpenTelemetry Protocol (OTLP) receiver. An OTLP receiver is a wire protocol supported by all OpenTelemetry SDKs which can send data to the OpenTelemetry Collector.
Helpful Articles!
Edge Delta recently released native support for OTLP. Edge Delta’s Visual Pipelines platform will automatically collect, process, and forward log and metric data in the OTLP standardized schema.
Now run the collector in a docker container:
docker run -p 4317:4317 -p 4318:4318 --rm -v $(pwd)/collector-config.yaml:/etc/otelcol/config.yaml otel/opentelemetry-collectorThis collector can now accept telemetry via OTLP.
OTLP Exporter Dependencies
For sending telemetry data to an OTLP endpoint (Prometheus, OpenTelemetry Collector, etc.), here are the OTLP exporter dependencies to install:
HTTP/protobuf:
npm install --save @opentelemetry/exporter-trace-otlp-proto
  @opentelemetry/exporter-metrics-otlp-proto
HTTP/JSON:
npm install --save @opentelemetry/exporter-trace-otlp-http
  @opentelemetry/exporter-metrics-otlp-http
gRPC:
npm install --save @opentelemetry/exporter-trace-otlp-grpc
  @opentelemetry/exporter-metrics-otlp-grpc
Then, you must configure the exporter to point to an OTLP endpoint. This step usually involves specifying the endpoint URL and any additional configuration options.
OpenTelemetry supports two primary methods of exporting data from a process to an analysis backend:
Method 1: Directly from a Process. This method requires you to import and take a dependency on one or more exporters and libraries. These exporters and libraries translate OpenTelemetry in-memory span and metric objects into appropriate formats for tools like Prometheus.
Method 2: Proxying it through the OpenTelemetry Collector. This method helps certify that the data is exported correctly.
Here is the setup for different backends:
Jaeger
This backend natively supports OTLP to receive trace data. Run it in a docker container with the UI accessible on port 16686, and OTLP enabled on ports 4317 and 4318:
docker run --rm
  -e COLLECTOR_ZIPKIN_HOST_PORT=:9411
  -p 16686:16686
  -p 4317:4317
  -p 4318:4318
  -p 9411:9411
  jaegertracing/all-in-one:latest
Now, you can set up the OTLP exporters.
Prometheus
If you want to send metric data to Prometheus, you can enable Prometheus’ OTLP Receiver and use the OTLP exporter. You can also use a Metric Reader like the PrometheusHttpServer. It starts an HTTP server that collects metrics and serializes them to Prometheus text format on request.
Prometheus can be setup in a docker container, accessible on port 9090 through these steps:
Step 1: Create a file called prometheus.yml, and populate it with the information below:
scrape_configs:
  - job_name: dice-service
    scrape_interval: 5s
    static_configs:
      - targets: [host.docker.internal:9464]
Step 2: Run Prometheus in a docker container with the UI accessible on port 9090:
docker run --rm -v ${PWD}/prometheus.yml:/prometheus/prometheus.yml -p 9090:9090 prom/prometheus --enable-feature=otlp-write-receiveNow, you can set up the Prometheus or OTLP exporter dependencies for your application.
Zipkin
Without Zipkin or a Zipkin-compatible backend already set up, you can run Zipkin in a Docker container as follows:
docker run --rm -d -p 9411:9411 --name zipkin openzipkin/zipkinYou can now set up the Zipkin exporter dependencies as required for your particular application.
Benefits of OpenTelemetry Tracing
OpenTelemetry Tracing provides you with deep insights into the behavior and performance of your applications and services. It enables a critical piece of observability for you to work with, so you can uncover and diagnose issues faster and more effectively.
Helpful Article!
If you’re struggling to achieve observability within your systems, it can be due to a number of different issues. Check out these six common observability mistakes and learn how to fix them.
If you’re wondering what OpenTelemetry Tracing is used for, it ensures the reliability of systems and makes way for performance optimization. Check out the rest of the article below to elaborate on this topic.
Enhanced Observability
OpenTelemetry tracing provides comprehensive visibility into application performance and behavior. It does so by visualizing the journey of a request as it traverses through different components. This end-to-end visibility helps understand what is happening in the internal state of a system.
Detailed telemetry data such as logs, metrics, and traces help identify bottlenecks and errors quickly. Operations teams can then troubleshoot and optimize systems proactively.
Standardization
OpenTelemetry establishes a standard framework for tracing, which means it can fit within any application’s architecture. It adheres to a single specification to ensure consistency across vendors. Read more on Edge Delta’s support for native OTLP and OpenTelemetry standards here!
Integration with Other Tools
OpenTelemetry provides standardized APIs for instrumentation. Regardless of the underlying technology stack, you can easily integrate tracing into your applications.
Making telemetry ubiquitous promotes effective observability. Observability solutions can easily consume data generated by OpenTelemetry without the need for complex configurations or custom development efforts.
Improved Performance Monitoring
OpenTelemetry helps identify performance bottlenecks and improve application performance through the following:
- A unified approach to distributed tracing which gives a holistic view of system performance so you can identify correlations between data types and diagnose complex issues.
- Real-time monitoring which allows for prompt detection and response to issues and anomalies.
- Instrumenting applications at a granular level to identify areas of improvement and fine-tune performance optimizations.
- Reduced overhead so performance monitoring does not degrade the system’s performance.
- Seamless integration with observability platforms enables you to leverage your existing monitoring infrastructure.
- Flexibility for customization makes your performance monitoring capabilities extensive.
OpenTelemetry Tracing Use Cases
OpenTelemetry tracing has various use cases as a powerful tool for monitoring and understanding distributed systems. General examples of these include end-to-end transaction tracing, performance monitoring, debugging, and troubleshooting.
Here are some everyday use cases of OpenTelemetry tracing:
Microservices Monitoring
Each microservice adds trace data (timestamps, service names, etc.) to a request as it passes through. OpenTelemetry tracing helps understand the flow of transactions in microservice architectures.
You can capture data about requests and responses and correlate them as they go through various microservices utilized by your organization. This feature allows monitoring and troubleshooting whenever necessary.
Performance Optimization
Developers can use OpenTelemetry to gain insight into application behavior. Performance issues in software systems may involve slow database queries or overloaded services, for instance, and understanding the latency and execution flow of requests leads to quicker detection of performance bottlenecks. This way, you can iteratively update your code and offer the best user experience.
Root Cause Analysis
Failures within distributed systems often have root causes. OpenTelemetry enables root cause analysis through many UI components of Application Observability. With this function, users can uncover why and how a problem arose. For instance, the root cause of an application with a slow response time could be inefficient code, or inadequate resource allocation to a particular server. To correctly resolve an underlying problem, OpenTelemetry ensures you uncover the appropriate issue and avoid recurrence.
Compliance and Auditing
The Payment Card Industry Data Security Standard (PCI DSS) defines security requirements (technical and operational) for protecting payment account data. OpenTelemetry aligns with PCI DSS compliance efforts, providing real-time insights into system performance. For instance, think of stored cardholder data. OpenTelemetry gives a vision of its journey across systems so you can ensure that encryption is consistently applied. You can also monitor firewall efficacy for a robust perimeter defense.
OpenTelemetry also provides detailed audit trails and enables access control to ensure compliance. For instance, a payment processor can use OpenTelemetry logs to audit database access. This function ensures that only authorized personnel can view sensitive cardholder data.
OpenTelemetry Tracing vs OpenTracing
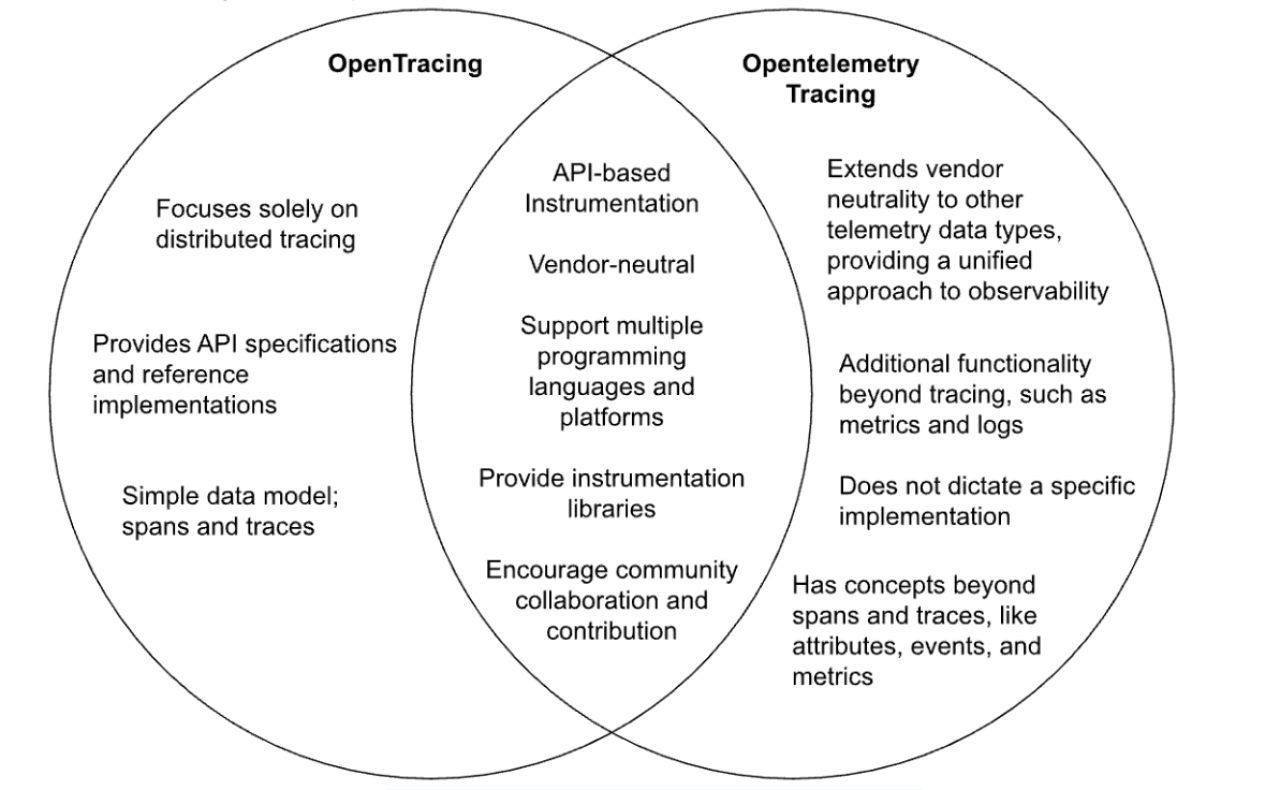
Users often think of OpenTelemetry Tracing and Open Tracing as one and the same. However, the two differ in several ways. OpenTracing was a vendor-agnostic set of APIs and libraries for easy tracing instrumentation in a code base. OpenTelemetry was developed as a successor to OpenTracing after combining the latter with OpenCensus. Since OpenTracing was deprecated to make way for OpenTelemetry tracing, they share many similarities. This updated version takes the best aspects of OpenTracing and OpenCensus with new and better features.
Here’s a side-by-side comparison of the two frameworks:
Conclusion
Distributed systems by nature contain multiple components, and any action requires them to work properly in tandem. Fortunately, you can leverage tools like OpenTelemetry and its tracing-specific framework to standardize the process of instrumenting systems to produce traces, to help ensure the different pieces of the system work as they should.
Through OpenTelemetry tracing, you can monitor requests as they move from one service to another. This feature helps users understand service connections, diagnose latency issues, and more. OpenTelemetry offers tools and insights needed to build and maintain reliable distributed systems in complex computing environments. If you are still using a traditional method of application performance monitoring, definitely consider giving OpenTelemetry a shot.
OpenTelemetry Tracing FAQs
What is the purpose of OpenTelemetry?
OpenTelemetry is a framework designed to help capture requests between microservices. It offers a unified method to collect data, resulting in simplified application monitoring, troubleshooting, and debugging.
What is the difference between OpenTracing and OpenTelemetry?
OpenTracing focuses on distributed tracing in its framework. Meanwhile, OpenTelemetry also covers metrics and logs (along with tracing).
What is the difference between metrics and traces in OpenTelemetry?
Metrics provide statistical information for specific functions, operations, etc., while traces capture a request lifecycle end-to-end. Moreover, traces provide context into the individual components of a request.
What is a telemetry trace?
A telemetry trace represents a request’s journey throughout a system. With traces, you can get a detailed picture of its interactions. Telemetry traces are made up of spans containing attributes and events. These data sets describe and contextualize the work done across processes and services.
Sources:

