

AWS Lambda logging is easy to enable but hard to control. Logging costs can rise from $5,000 to $30,000 per month as traffic grows. Teams spend hours tracing requests without correlation IDs, and long, rarely accessed production logs quickly consume budgets.
Common challenges include indefinite retention that drives up costs, DEBUG logs that generate up to 80% more volume than necessary, manual cross-function log correlation, and inefficient queries that scan 100 times more data than needed.
This guide offers 10 practical logging practices with working examples, real cost calculations, and clear timelines. Used together, these strategies typically reduce expenses by 50–80%, cut troubleshooting time to 15–30 minutes, and speed up queries 10–100 times.
Key Takeaways
• Native JSON logging takes about five minutes to enable and provides structured fields automatically.
• ERROR-only production logging reduces volume by 70–85%, and 30-day retention prevents cost growth.
• Small apps typically cost $5–20/month, medium workloads $200–500, and high-volume systems $2K–10K. Basic optimization can save 50–80%.
• One request often spans multiple Lambdas, scattering logs across streams.
• Without correlation IDs, tracing takes 4–8 hours. With them, it drops to 15–30 minutes.
• Log groups never expire unless configured, so storage grows every month. At 100 GB, costs rise from $3/month in year one to $36/month by year ten.
• Logs Insights charges by data scanned, not query count. Poor queries can scan 100 TB ($500), while time-filtered queries scan ~100 GB ($0.50).
• Powertools makes production logging practical. This official AWS library adds correlation IDs, structured fields, and sampling.
• Week one changes (JSON, log levels, retention) typically cut costs by 60–80%. Powertools and correlation IDs follow in month one, with deeper tuning later.
Note*: Pricing, runtime support, and service features were verified against AWS documentation in December 2025.*
10 Lambda Logging Best Practices
Lambda logs are easy to enable and easy to misuse. Without discipline, they grow expensive and unhelpful. These practices focus on keeping logs actionable, predictable, and worth their cost.
1. Enable Native JSON Logging
In late 2023, AWS Lambda added support for native JSON logging. It automatically changes stdout and stderr into structured JSON without using any additional libraries. It works with Node.js 18+, Java 11+, and Python 3.8 and higher, and the format of the output is compatible with OpenTelemetry.
A scalable Lambda logging technique starts with native JSON logging. Filtering, correlation, and cost control don’t work without organized logs. These are common pitfalls in AWS Lambda logging, especially when multiple teams or services are involved.
Enable JSON logging in the console under Configuration → Monitoring → Log format → JSON, or via CLI:
aws lambda update-function-configuration \
  --function-name my-function \
  --logging-config LogFormat=JSON
Lambda automatically adds the requestId, level, message, and timestamp to CloudWatch logs. There is a traceId field if AWS X-Ray is turned on. CloudWatch Logs Insights finds fields on its own, so you don’t have to use regex to do so.
Queries typically run 10–50× faster due to structured filtering. Log format remains consistent across runtimes. There is no increase in ingestion costs.
Python example:
import logging

logger = logging.getLogger()
logger.setLevel(logging.INFO)

def handler(event, context):
    logger.info("User created")
When JSON logging is turned on, Lambda sends structured fields by default, which means that CloudWatch Logs Insights can filter logs right away without having to parse them.
CloudWatch Logs Insights query:
fields @timestamp, level, message
| filter level = "ERROR"
| sort @timestamp desc
Native JSON logging is sufficient for basic structured logs. Use AWS Powertools when you need correlation IDs, sampling, or enriched context. Setup takes about five minutes per function. Faster queries reduce total scan costs.
2. Configure Log Levels for Each Environment
AWS Lambda provides two log controls: the application log level set in code and the system log level enforced by the platform. The system log level filters logs before they reach CloudWatch and works without code changes.
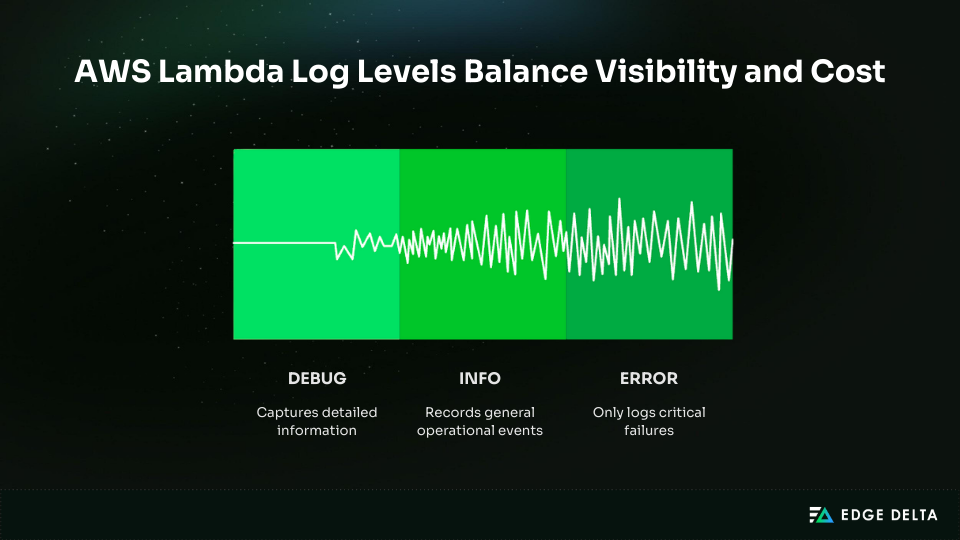
Supported levels include DEBUG, INFO, WARN, and ERROR, depending on the runtime. With native JSON logging enabled, the default system level is INFO.
Setting production functions to ERROR-only greatly reduces log volume while preserving visibility into failures. Most production logs add little value and are rarely queried.
Early filtering cuts down on the expenses of ingestion, storage, and queries. Teams usually cut log volume by 70–85% without losing important messages.
| Level | Typical use | Relative volume |
|---|---|---|
DEBUG | Development | Very high |
INFO | Staging | Medium |
ERROR | Production | Low |
Cost calculation example
Assume 1 million invocations per day:
- DEBUG: ~5 KB per invocation → ≈ $150/month
- ERROR-only: ~0.5 KB per invocation → ≈ $22/month
This represents an 85% monthly savings, or $128 per function.
Use DEBUG in development, INFO in staging, and ERROR in production. This approach balances visibility, reliability, and cost control.
Log levels can be updated via API without redeploying the function:
aws lambda update-function-configuration \
  --function-name my-function \
  --logging-config LogFormat=JSON,ApplicationLogLevel=ERROR
3. Use AWS Powertools for Production Logging
Native JSON logging provides basic structure but falls short for real-world demands. It lacks correlation IDs, sampling, and consistent context across services — issues that typically surface only during events, not development.
AWS Lambda Powertools is an AWS-maintained toolkit that adds:
- Structured JSON logs with a consistent schema
- Automatic correlation ID extraction
- Configurable log sampling
- Service name and cold start fields
It works across Python, Node.js, Java, and .NET with minimal overhead.
Basic Setup (Python)
from aws_lambda_powertools import Logger
logger = Logger(service="orders")

def handler(event, context):
    logger.info("Order created")
Basic Setup (Node.js)
import { Logger } from "@aws-lambda-powertools/logger";
const logger = new Logger({ serviceName: "orders" });
logger.info("Order created");
For easy tasks or tasks with little risk, use native JSON logging. Use Powertools for production APIs, async pipelines, and anything that has to work with more than one service.
Native JSON vs Powertools
| Capability | Native JSON | Powertools |
|---|---|---|
| Structured logs | Yes | Yes |
| Correlation IDs | No | Yes |
| Sampling | No | Yes |
Pro tip: Powertools supports log sampling, letting you capture DEBUG logs for a small percentage of production traffic (~10%). This preserves diagnostic detail while reducing DEBUG log volume by roughly 90%.
4. Implement Correlation IDs for Distributed Tracing
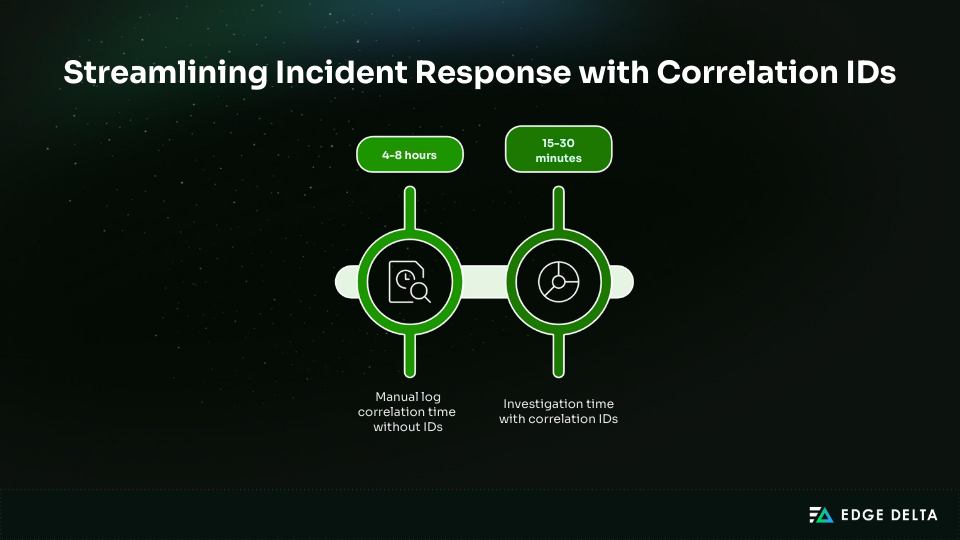
Distributed requests often span multiple Lambdas, queues, and APIs, fragmenting logs across services. During incidents, manually correlating these logs can take 4–8 hours.
Correlation IDs assign a single identifier to a request across all services, letting engineers trace activity by filtering on one value and reinforcing how logs, metrics, and traces drive observability value. This typically cuts investigation time to 15–30 minutes.
Lambda request IDs are not the same as correlation IDs. There is only one Lambda request ID for each invocation. A correlation ID, on the other hand, represents a user request and stays the same from start to finish. It is commonly given through the x-correlation-id HTTP header.
An example of a request flow is Client → API Gateway → Lambda A → SQS → Lambda B → downstream API. At every hop, the identical correlation ID is sent along.
Powertools Implementation (Low Code):
from aws_lambda_powertools import Logger

logger = Logger()
logger.append_keys(correlation_id="extracted-from-header")

def handler(event, context):
    logger.info("Processing request")
Manual Python example:
import contextvars
correlation_id = contextvars.ContextVar("correlation_id")
correlation_id.set("abc123")
Propagation uses HTTP headers, SQS MessageAttributes, or SNS MessageAttributes.
CloudWatch Logs Insights query:
fields @timestamp, message
| filter correlation_id = "abc123"
Without correlation IDs, troubleshooting takes hours. With correlation IDs, most investigations are completed in minutes, improving reliability and incident response.
5. Master CloudWatch Logs Insights Queries
CloudWatch Logs Insights charges per GB scanned rather than per query, unlike Athena, which costs $5 per TB scanned. Inefficient queries still increase costs by scanning unnecessary data during investigations.
The most common problem is a lack of time filters. Queries that don’t have timestamp limits look over all accessible log partitions. Adding a time filter initially usually cuts down on the amount scanned by 90–99%.
Query Optimization Hierarchy:
- Time filter first
| filter @timestamp > ago(7d)- Filter early to remove noise before aggregation
- Project fields to reduce in-memory processing
Common Query Patterns
Error rate analysis
filter level = "ERROR" and @timestamp > ago(1d)
| stats count() by service
Latency percentiles
filter @timestamp > ago(7d)
| stats pct(duration,50), pct(duration,95), pct(duration,99)
Correlation ID trace
filter correlation_id = "abc123"
| sort @timestamp asc
Failed invocations
filter status = "failed" and @timestamp > ago(24h)Query Optimization Impact
| Query approach | Data scanned |
|---|---|
| No time filter | 100 TB |
| Time filter first | 100 GB |
This reduction improves query performance and minimizes downstream investigation overhead.
Performance Benchmarks
| Query scope | Execution time |
|---|---|
| 7 days, simple filters | 1–5 seconds |
| Complex aggregations | 30–60 seconds |
Saved queries allow teams to standardize investigations and shorten incident response across environments.
6. Set Retention Policies to Control Costs
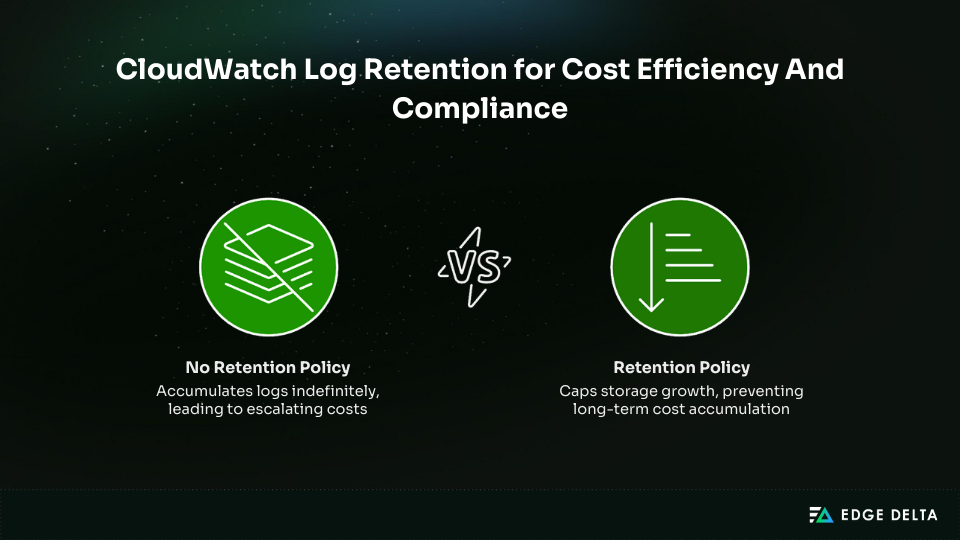
By default, CloudWatch log groups never expire. Logs accumulate indefinitely, causing storage costs to grow each month as new data is added. Without retention policies, logging expenses compound over time, even if functions remain unchanged.
Retention policies prevent storage from growing unchecked by automatically deleting old logs. They control costs and ensure that the most recent data is available for troubleshooting.
Cost Impact Comparison
| Scenario | Year 1 | Year 3 | Year 10 |
|---|---|---|---|
| 100 GB, never expires | $3/month | $9/month | $36/month |
| 100 GB, 30-day retention | $3/month | $3/month | $3/month |
A 30-day retention policy delivers approximately 96% long-term savings by preventing cumulative storage growth.
Recommended retention periods:
- General workloads: 7–30 days
- PCI-DSS: 90 days
- HIPAA: 6 years (archive externally)
Retention can be configured per log group.
CLI: Set retention
aws logs put-retention-policy \
  --log-group-name /aws/lambda/my-function \
  --retention-in-days 30
CLI: Identify log groups without retention
aws logs describe-log-groups \
  --query 'logGroups[?retentionInDays==null].logGroupName'
Use EventBridge to detect CreateLogGroup events and trigger a Lambda function that automatically applies retention. This ensures new log groups do not default to indefinite retention.
Export logs to Amazon S3 and move them to Glacier for compliance-driven retention. This approach keeps logs secure and low-cost while keeping CloudWatch storage predictable and under control.
7. Optimize Storage with S3 Export and Lifecycle Policies
CloudWatch Logs is effective for active troubleshooting but costly for long-term retention.
Storage costs $0.03 per GB per month, and total costs grow as log volume increases. Exporting logs to Amazon S3 enables cheaper storage tiers and lifecycle policies to reduce long-term costs.
Storage Cost Comparison
| Storage tier | Monthly cost |
|---|---|
| CloudWatch Logs | $0.03 per GB |
| S3 Standard | $0.023 per GB |
| S3 Glacier Deep Archive | $0.00099 per GB |
Storage costs for S3 Standard are around 23% less than for CloudWatch Logs. Glacier Deep Archive costs about 97% less, which makes it a good choice for long-term storage of compliance data.
Export methods:
- Manual: Export log groups from the CloudWatch console
- Automated: Configure direct S3 delivery using Lambda
LoggingConfig - Streaming: Use Kinesis Firehose at $0.029 per GB
For higher-volume systems, teams sometimes stream Lambda logs through external pipelines for real-time processing before they reach CloudWatch or S3. AWS Lambda monitoring with Edge Delta is an example of this model. It lets you filter and add to data earlier in the lifecycle.
Direct S3 delivery example:
LoggingConfig:
  LogFormat: JSON
  Destination: S3
Lifecycle strategy – Logs should move through tiers as access frequency drops:
{
  "Rules": [{
    "Transitions": [
      { "Days": 30, "StorageClass": "STANDARD_IA" },
      { "Days": 60, "StorageClass": "GLACIER" },
      { "Days": 365, "StorageClass": "DEEP_ARCHIVE" }
    ]
  }]
}
Seven-year cost for 1 TB of logs:
- CloudWatch only: $2,520
- S3 Standard: $1,932
- S3 with lifecycle policies: ~$400
Logs stored in S3 require Athena queries at $5 per TB scanned or temporary rehydration. This approach minimizes storage costs while preserving auditability and compliance.
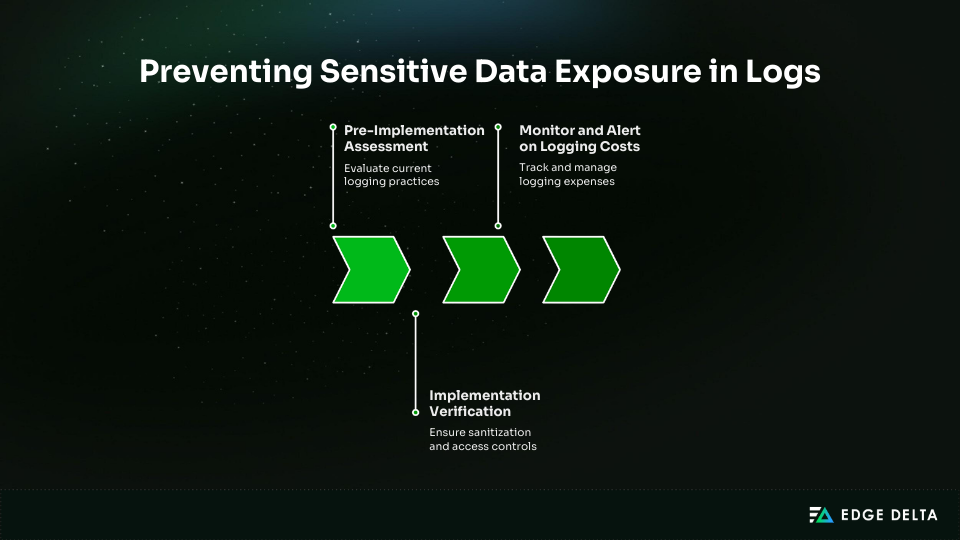
8. Prevent Sensitive Data Exposure
Source: AWS Lambda Logging Best Practices (4).png
When full request bodies or headers are logged by default, logs can show private information. Logging passwords, API keys, tokens, credit card numbers, and personal information (PII) is a common problem. It’s hard to remove this information once it’s in logs, and it’s easy to show too much of it.
The effect on compliance is substantial. GDPR infractions can cost up to 4% of a company’s annual revenue. PCI-DSS violations can trigger audits, penalties, or loss of card processing privileges. Logs are often overlooked during security reviews.
Prevention starts with sanitizing inputs before logging. Redact sensitive fields so secrets never reach CloudWatch. Use an allowlist and log only approved attributes.
| Never log | Safe to log |
|---|---|
| • Passwords • API keys or tokens • Credit card numbers • SSNs | • Request IDs • Correlation IDs • Timestamps • Status codes • Resource ARNs |
Python sanitization example:
def sanitize(data):
    allow = {"requestId", "status"}
    return {k: v for k, v in data.items() if k in allow}
Node.js sanitization example:
function sanitize(obj) {
  const allow = ["requestId", "status"];
  return Object.fromEntries(
    Object.entries(obj).filter(([k]) => allow.includes(k))
  );
}
CloudWatch Logs are encrypted at rest by default using AWS-managed keys. Customer-managed KMS keys can be configured for stricter control.
Apply least-privilege IAM access to logs:
{
  "Effect": "Allow",
  "Action": ["logs:DescribeLogStreams",
 "logs:GetLogEvents"],
  "Resource": "arn:aws:logs:*:*:log-group:/aws/lambda/*"
}
9. Monitor and Alert on Logging Costs
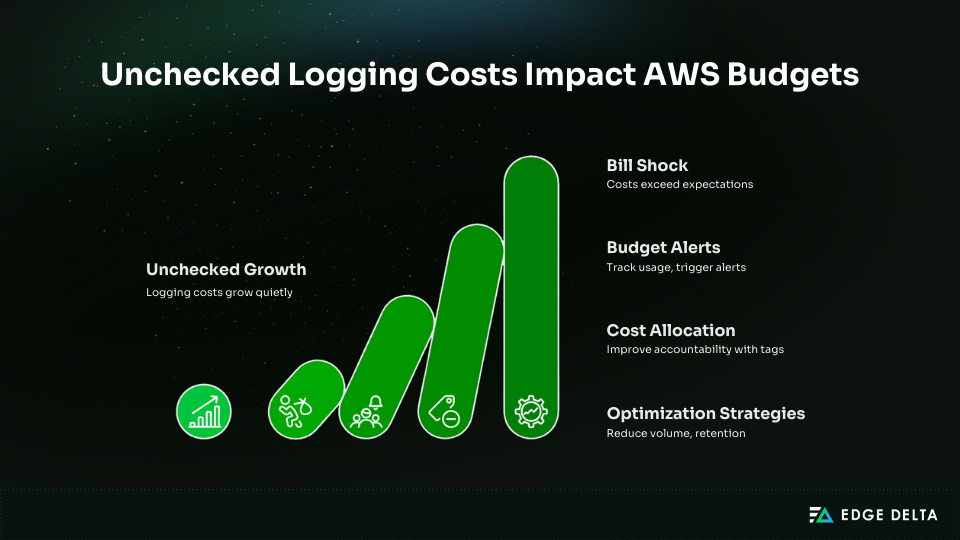
CloudWatch logging costs often grow quietly as workloads scale, reflecting broader data growth trends shaping observability strategies. Without active monitoring, teams follow a predictable pattern.
The pilot might cost about $5,000 in the first month. By the sixth month, extra responsibilities can cost up to $25,000. Unchecked growth can go above $75,000 by the twelfth month.
Budget alerts help prevent this bill shock. AWS Budgets allows teams to track CloudWatch usage and trigger alerts before costs exceed expectations. Alerts at 50%, 80%, and 100% of a monthly logging budget give teams time to adjust log levels, retention, or export strategies.
Budget alert configuration
- Service: CloudWatch
- Cost type: Usage or Cost
- Thresholds: 50%, 80%, 100%
- Notifications: Email or SNS
Cost allocation makes people more responsible. To make showback or chargeback reporting possible and find workloads that cost a lot, tag Lambda functions and log groups with Service, Environment, or Team tags. You should check log groups that get a lot of traffic and aren’t being used often.
High-cost log group query:
stats sum(@ingestedBytes) by @log
| sort sum desc
Logging Cost Optimization Strategies
| Strategy | Impact |
|---|---|
| ERROR-only production logs | 70–85% volume reduction |
| Shorter retention | Stops cost accumulation |
| Infrequent Access log class | ~40% cheaper storage |
| Predictable workload commitments | Lower per-GB cost |
Lambda does not support data collection rules, but log level controls and retention policies provide effective cost control. Continuous monitoring keeps logging spend aligned with business value.
10. Integrate with X-Ray for Visual Tracing
AWS X-Ray adds visual tracing to Lambda-based designs. It lets you trace requests from start to finish, see service maps, and see how long it takes for different AWS services to respond. X-Ray is not required, but it is useful for complicated, distributed systems where knowing how services depend on each other is important.
When X-Ray is enabled, Lambda automatically associates a trace ID with each invocation. With native JSON logging enabled, this traceId is added to log entries, allowing direct correlation between logs and traces without custom instrumentation.
Configuration
X-Ray can be enabled through the Lambda console or infrastructure templates:
TracingConfig:
  Mode: Active
Once enabled, supported AWS services participate automatically. No changes to the application code are required for basic tracing.
Cost and Overhead
X-Ray pricing is usage-based:
- $5 per 1 million traces recorded
- $0.50 per 1 million traces scanned
Tracing makes things harder to measure. Depending on the depth of the service and the sample rate, teams usually witness 20 to 50 milliseconds per traced request. This extra labor should be carefully looked at for workloads with a lot of data.
Correlation IDs vs X-Ray
| Capability | Correlation IDs | X-Ray |
|---|---|---|
| Cost | Free | Paid |
| Visual service map | No | Yes |
| End-to-end latency | Partial | Full |
| Log correlation | Yes | Yes |
Recommended Use Cases
| Scenario | Recommendation |
|---|---|
| Simple or low-latency services | Correlation IDs |
| Incident response | Correlation IDs |
| Complex microservices | X-Ray |
| Existing X-Ray adoption | X-Ray |
X-Ray complements logging rather than replacing it. Correlation IDs remain sufficient for many teams. X-Ray is most valuable when visual dependency mapping and latency analysis are required across multiple services.
Implementation Checklist and Timeline
This checklist ensures each logging improvement is implemented correctly, verified, and measured. It helps teams avoid partial rollouts that fail to deliver cost or observability gains.
Pre-Implementation Assessment
Start by documenting the current state. This creates a baseline for cost, volume, and troubleshooting time.
Current state audit:
- Count Lambda functions across all accounts and regions
- Measure current log volume in GB per month
- Document existing CloudWatch Logs costs
- Check log group retention settings and flag never-expire policies
- Identify distributed workflows that require correlation
- Review compliance requirements such as GDPR, PCI-DSS, or HIPAA
Technical requirements:
-
Verify runtime versions support native JSON logging
- Python 3.8 or newer
- Node.js 18 or newer
- Java 11 or newer
-
Confirm IAM roles allow CloudWatch log write access
-
Identify functions using existing logging libraries
-
Document current CloudWatch Logs Insights query patterns
This assessment typically takes one to two hours and prevents rework later.
Implementation Verification
Use this checklist to confirm each logging change is correctly applied and delivering the expected impact.
JSON Logging
- JSON log format enabled for each function
- Test invocation produces structured JSON in CloudWatch
- Default fields present (timestamp, level, requestId)
- Logs Insights queries work without regex parsing
Log Levels
- Log levels configured per environment
- DEBUG limited to development or staging
- Production logs filtered at ERROR
- Log volume reduction verified
- No critical errors suppressed
Correlation IDs
- Correlation IDs generated or extracted at entry points
- IDs propagated across services and queues
- Correlation IDs present in all relevant log entries
- Logs Insights queries successfully filter by correlation ID
Retention and Cost Controls
- Explicit retention set on all log groups
- No log groups with infinite retention
- Automated retention applied to new log groups
- Baseline logging costs documented
- Budget alerts configured and tested
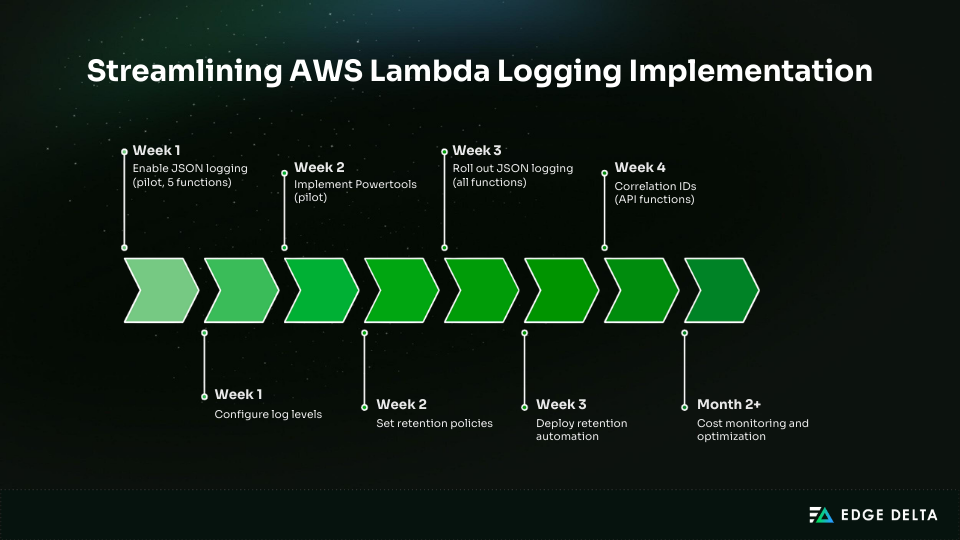
Implementation Timeline Table
| Phase | Task | Time | Outcome |
|---|---|---|---|
| Week 1 | Enable JSON logging (pilot, 5 functions) | 30 min | JSON visible in CloudWatch |
| Week 1 | Configure log levels | 20 min | Volume reduction visible |
| Week 2 | Implement Powertools (pilot) | 3–4 hours | Correlation tracking |
| Week 2 | Set retention policies | 1–2 hours | 30-day retention enforced |
| Week 3 | Roll out JSON logging (all functions) | 4–8 hours | Consistent log format |
| Week 3 | Deploy retention automation | 1–2 hours | Auto-retention for new logs |
| Week 4 | Correlation IDs (API functions) | 8–12 hours | End-to-end tracing |
| Month 2+ | Cost monitoring and optimization | 2–4 hours per month | Budget compliance |
Total effort
- Pilot of five functions: 8–12 hours over two weeks
- Full rollout of 100 functions: 20–35 hours over four weeks
Real-World Implementation Outcomes
The following outcomes come from a production AWS Lambda environment after implementing structured logging, correlation IDs, retention controls, and query optimization. Each example shows measurable improvements in security response, operational efficiency, and logging costs.
Security Investigation
A credential misuse incident required tracing activity across 12 Lambda functions. Logs were spread across multiple log groups and streams, and investigators had to manually search large volumes of unrelated data. Identifying the affected requests took nearly 8 hours.
After correlation IDs were sent over the API Gateway and downstream Lambdas, investigators used CloudWatch Logs Insights to filter logs by a single ID. It took 22 minutes to identify the problem after reviewing 847 pertinent records, and the compromised credentials were removed the same day.
Query used
filter correlation_id = "c-9f82a1"
| sort @timestamp asc
Cost Optimization
Logging volume had grown to 2.1 TB per month, driven by DEBUG logging in production and log groups with no retention limits. CloudWatch costs reached roughly $63,000 per year, even though most logs were rarely queried.
The team reduced noise by switching production functions to ERROR-only logging, applying 30-day retention, and exporting older logs to S3 with lifecycle policies. These changes took 16 hours over two weeks to roll out.
Monthly log volume dropped to 420 GB, bringing annual logging costs down to $12,600. That’s a $50,400 annual savings, or an 80% reduction, without losing operational visibility.
Compliance Audit
A PCI-DSS audit required exporting and validating historical logs across multiple Lambda functions. Evidence had to be assembled manually, and engineers spent roughly 40 hours preparing audit materials.
Saved CloudWatch Logs Insights queries and automated S3 exports changed the workflow. Investigators filtered ERROR-level events over a 90-day window and pulled compliant records directly from S3.
Audit preparation time dropped to 12 hours (a 70% reduction) with far less manual handling.
Query used
filter level="ERROR" and @timestamp > ago(90d)
| fields @timestamp, service, message
Troubleshooting and MTTR
After a deployment, an API began returning intermittent 500 errors. Logs were spread across multiple Lambda functions, and engineers had to search each log group separately. Mean time to resolution was around 2.5 hours.
With correlation IDs set up and production logs set to ERROR, the failing version showed up shortly. A single Logs Insights query found the problem in 18 minutes, cutting down on noise throughout the inquiry and speeding up MTTR by 77%.
Query used
filter level="ERROR" and @timestamp > ago(2h)
| stats count() by version
Key Implementation Considerations
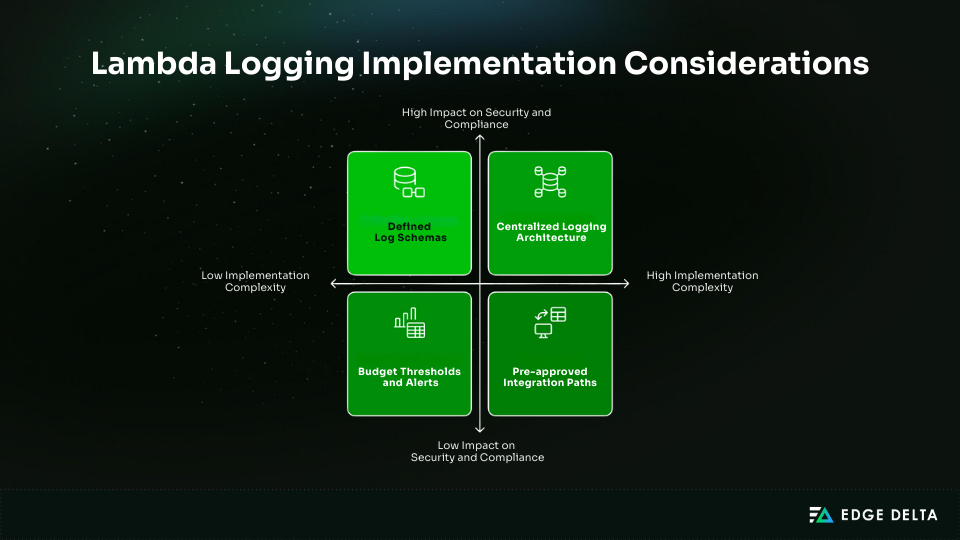
For Lambda logging to work well, there needs to be unambiguous ownership and consistent execution. Platform teams should set criteria for security, retention, and other things, and application teams should follow those requirements in their code.
Choose the logging architecture early in environments with many accounts. Centralized aggregation makes security and compliance better, whereas distributed logging lowers the possibility of cross-account issues. A lot of teams employ a mix of models.
Key decisions to make up front:
- Cost budgets and alerts to keep logging within 1–3% of total AWS spend
- Standard log schemas and required fields for correlation and analysis
- Approved integration paths for SIEM and monitoring tools
- Regular governance, including retention reviews and sensitive-data audits
- Targeted developer training (2–4 hours) on logging, log levels, and correlation IDs
Conclusion
Effective Lambda logging requires clear ownership and consistent execution. Platform or cloud teams should define standards, retention, and security controls, while development teams implement them reliably in code.
Logging architecture must be decided early in multi-account environments. Centralized aggregation supports security and compliance, while distributed logging reduces cross-account risk. Many teams use a hybrid approach.
To keep logging effective and sustainable, teams should set cost budgets, standardize log schemas, plan SIEM integrations, review retention regularly, audit for sensitive data, and provide targeted developer training.
Frequently Asked Questions
What is the difference between Lambda’s native JSON logging and Powertools Logger?
Lambda can natively emit structured JSON logs by configuring the function’s log format. Powertools Logger provides a richer, consistent, structured logging API with automatic metadata, simplifying log formatting and context enrichment.
How much does Lambda logging costin CloudWatch?
Lambda logs sent to CloudWatch Logs are billed as vended logs with tiered pricing. Delivery to S3/Firehouse also has tiered fees. Storage and ingestion costs vary by volume.
How do I implement correlation IDs in Lambda functions?
Generate or propagate a unique ID per request. Inject it into structured logs and pass it to downstream services or other Lambdas. Tools like AWS X-Ray or Powertools can help include trace/correlation IDs for distributed tracing.
What log retention period should I use for Lambda functions?
Choose a log retention policy based on operational and compliance needs. AWS documentation recommends at least 7 days for troubleshooting, but production systems often use 30-90+ days. Longer retention increases CloudWatch storage costs.
How do I troubleshoot missing or delayed Lambda logs?
Verify that the Lambda execution role includes logs:CreateLogGroup, logs:CreateLogStream, and logs:PutLogEvents. Confirm the function is invoked, noting logs may take 5–10 minutes to appear in CloudWatch. If needed, enable debug logging or check extension buffering.
References:

