

Unexpected pod restarts in Kubernetes undermine application stability by disrupting workloads, masking underlying failures, and creating ongoing reliability risks. The latest data shows that 69% of organizations operate between 11% and 50% of their workloads without liveness probes. Without these probes in place, hidden failures can cascade into restart loops that weaken both performance and availability.
Some restarts are normal during deployments, but a spike can indicate deeper issues like resource exhaustion, probe misconfiguration, or dependency failures. Troubleshooting elevated restarts can be a drain on platform engineering teams’ time, and may be inefficient if root causes are not correctly diagnosed.
In this guide, we provide a structured approach to troubleshooting pod restarts by exploring restart patterns, diagnostic commands, workflows, and real scenarios. The goal is to help you shift from reactive firefighting to confident, predictable problem solving.
Key Takeaways
• Not all pod restarts are bad. Restarts during updates or scaling are normal, but frequent ones (e.g.,
CrashLoopBackOff,OOMKilled) point to deeper issues.• Most restart fall into five buckets: resource exhaustion, application crashes, infrastructure issues, configuration mistakes, and dependency failures.
• A structured workflow beats ad hoc debugging. Start with triage, then move into logs, metrics, and node checks as needed.
• Logs + events tell the full story. Events explain what happened; logs reveal why. Reviewing both avoids blind spots.
• Prevention matters as much as troubleshooting. Proactive monitoring, right-sizing resources, tuning probes, and analyzing restart patterns can help you reduce future incidents.
Understanding Kubernetes Pod Restarts
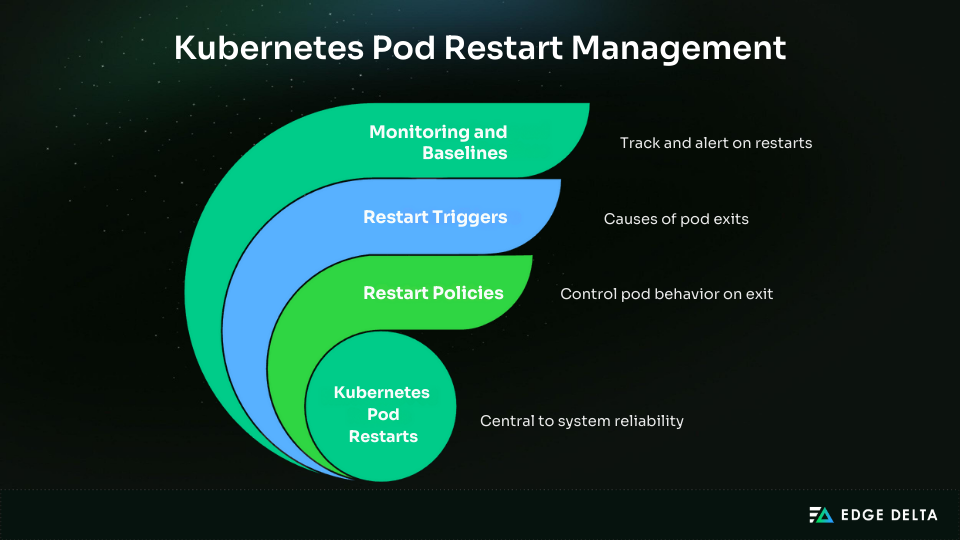
Distinguishing between routine behavior and signs of deeper failure is critical to establishing an efficient, scalable workflow for monitoring and troubleshooting pod restarts.
Normal vs Abnormal Restart Patterns
Restarts are part of normal Kubernetes operations, whether during deployments, rolling updates, or scaling events where old pods are intentionally replaced.
Abnormal restarts involve repeated failures, CrashLoopBackOff states, or OOMKilled events. These degrade reliability and demand attention. Frequency is key: one restart during an update is fine; multiple restarts in minutes are not.
To stay ahead of issues, set alerts on unusual restart counts. That way, you’ll catch abnormal patterns early instead of waiting for them to cause outages.
Restart Policies and Their Impact
Restart policies define Kubernetes behavior when containers exit. These are part of the broader Kubernetes restart policy framework, which controls whether pods are automatically restarted or left in a failed state. These policies are:
Always: Restart on any exit. This is the default for Deployments.OnFailure: Restart only if the container exits with a non-zero code. Commonly used by Jobs.Never: Do not restart containers.
Each policy balances convenience with visibility. Always ensures high availability but can conceal application crashes by restarting immediately. OnFailure and Never make failures more visible, though they may require manual intervention to resolve.
Pod Lifecycle and Restart Triggers
Pods transition through Pending, Running, and eventually Succeeded or Failed phases. Most restarts occur in the Running phase when containers exit unexpectedly.
Common triggers include:
- Resource exhaustion (
OOMKilled, CPU throttling) - Failed readiness or liveness probes
- Node pressure or evictions
- Network failures or preemptions
You can identify many of these triggers with kubectl describe pod and kubectl get events. For deeper root cause analysis, reviewing pod restart logs often provides the most definitive insights.
The 5 Primary Categories of Pod Restart Causes
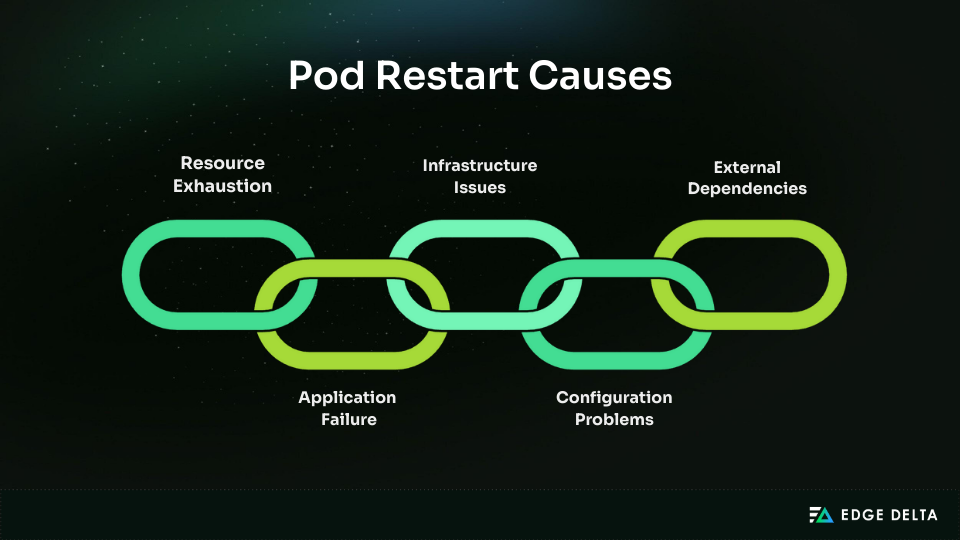
Most Kubernetes pod restarts fit into five categories. Understanding these categories makes troubleshooting faster, more consistent, and easier to automate. Each category has distinct patterns, diagnostic commands, and corresponding fixes.
Resource Exhaustion Restarts
Resource exhaustion, one of the most frequent causes of pod restarts, happens when workloads exceed CPU, memory, or disk allocations. When this happens, pods are terminated due to OOMKilled events, CPU throttling, or node-level evictions.
Investigating resource pressure early often reveals the need for right-sizing or scaling.
-
Symptoms:
OOMKilled- Throttling in
kubectl top pods - Eviction events
-
Triggers:
- Memory overuse
- Low CPU limits
- Node disk pressure
-
Investigation:
kubectl describe pod <pod> | grep -i OOMKilled
kubectl top pod <pod>
kubectl get events --field-selector involvedObject.name=<pod>- Resolution: Adjust resource requests/limits, optimize usage, scale with the HPA, and monitor node capacity.
Application Failure Restarts
Applications often restart after crashes from bugs, probe failures, or unhandled exceptions. These appear as pods stuck in CrashLoopBackOff states, making log inspection critical.
-
Symptoms:
- Pods in
CrashLoopBackOff - Logs show errors or probe failures
- Pods in
-
Triggers:
- Code bugs
- Misconfigured probes
- Uncaught exceptions
-
Investigation:
kubectl logs <pod> --previous
kubectl describe pod <pod> | grep -i reason-
Resolution:
- Fix application code or dependencies
- Adjust probe timing
- Improve error handling
Infrastructure-Related Restarts
Sometimes failures come from the cluster, not the pod. Node pressure, disk issues, or CNI errors can cause multiple pods to restart on the same node. Frequent warnings about pod eviction are common signals in this category.
-
Symptoms:
- Multiple pods restart on one node
- Events show pressure or network issues
-
Triggers: Node saturation
- CNI failures
- Node crashes
-
Investigation:
kubectl describe node <node>
kubectl get pods -o wide | grep <node>
kubectl get events --field-selector involvedObject.kind=Node-
Resolution:
- Drain/cordon unstable nodes
- Fix CNI issues
- Increase node resources
Configuration Problem Restarts
Misconfigured ConfigMaps, Secrets, or RBAC settings often cause pods to restart at startup. These failures usually appear as pods in a CrashLoopBackOff state with mount or permission errors.
-
Symptoms:
- Startup failures
- Logs show missing configs or permission errors
-
Triggers:
- Missing ConfigMaps/Secrets
- Invalid mounts
- RBAC issues
-
Investigation:
kubectl describe pod <pod> | grep -i mount
kubectl get configmap <name> -o yaml
kubectl get secret <name> -o yaml-
Resolution:
- Verify configs and secrets
- Correct mounts/paths
- Fix RBAC permissions
External Dependency Restarts
Pods depending on databases, APIs, or external services may restart if those services fail. In these cases, pod logs will usually show timeouts, DNS errors, or “connection refused.”
-
Symptoms:
- Logs show timeouts or connection errors.
-
Triggers:
- Database outages
- API downtime
- DNS failures
-
Investigation:
kubectl logs <pod>
kubectl exec -it <pod> -- curl <service-url>
kubectl describe service <service>-
Resolution:
- Add retry logic
- Monitor dependencies
- Use circuit breakers or fallbacks
Essential Diagnostic Commands and Techniques
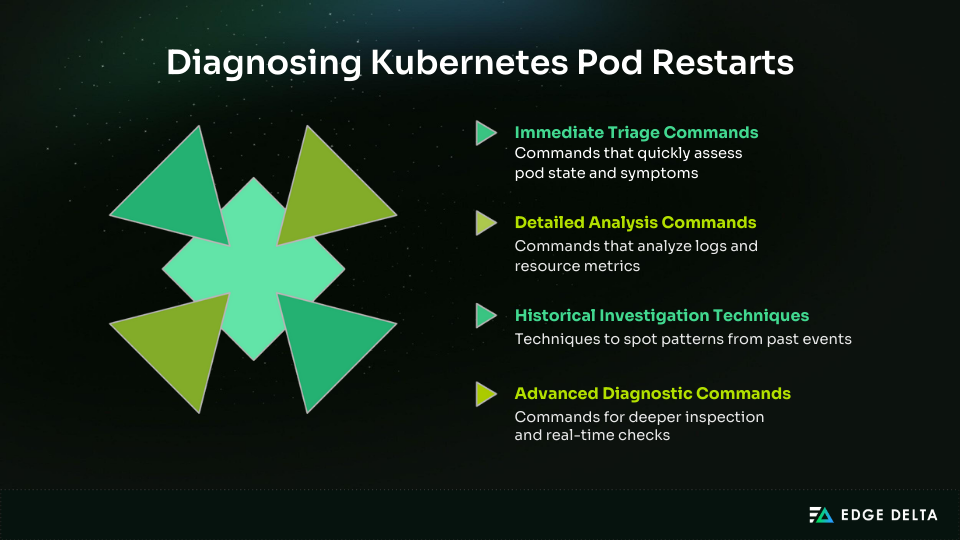
Troubleshooting Kubernetes pod restarts requires systematic use of diagnostic commands. Each command provides insights into pod state, resource usage, or cluster conditions. Organizing these commands by phase ensures efficient investigation.
Immediate Triage Commands
The first step in the restart investigation is confirming the pod’s current state. These commands reveal visible symptoms, like restart counts or event errors, that you can use to determine the next diagnostic step.
-
kubectl get pods:- Shows pod STATUS and RESTARTS
- A high restart count signals recurring failures
- Add
-n <namespace>for scope.
-
kubectl describe pod <pod-name>:- Provides details like LAST STATE, REASON, and MESSAGE (e.g.,
OOMKilled).
- Provides details like LAST STATE, REASON, and MESSAGE (e.g.,
-
kubectl get events --sort-by=.metadata.creationTimestamp:- Lists events in order
- Checks for scheduling failures, image pull errors, or evictions
-
kubectl get pod <pod-name> -o wide:- Adds node and IP details to detect node-related restarts or rescheduling
Detailed Analysis Commands
Once symptoms are identified, the next step is to analyze logs and resource metrics. The commands below identify application-level errors, misconfigurations, and resource saturation, which commonly cause restarts.
-
kubectl logs <pod-name>:- Retrieves recent logs
- Add
--previousfor the last terminated container
-
kubectl logs <pod-name> -c <container-name>:- Targets logs from multi-container pods
-
kubectl top pod <pod-name>:- Displays real-time CPU and memory usage
- Spikes often explain
OOMKills.
-
kubectl top node:- Shows node-level saturation that may cause throttling or eviction
-
kubectl get pod <pod-name> -o yaml:- Full spec with runtime details
- Checks probes and resource limits.
-
kubectl get deployment <deployment-name> -o yaml:- Confirms rollout and restart strategies
Historical Investigation Techniques
Not all restarts can be explained by the current pod state. Historical events and logs are essential for spotting patterns, scaling issues, or dependency failures that led to earlier restarts. The commands below surface pod histories.
-
kubectl get events --field-selector involvedObject.name=<pod-name>:- Filters pod-specific events
-
kubectl logs <pod-name> --since=1h:- Retrieves logs from a set timeframe to spot patterns
-
kubectl get pod <pod-name> -o=jsonpath='{.status.containerStatuses[*].lastState}':- Shows last container states with exit codes
-
kubectl get rs -n <namespace>:- Lists ReplicaSets
- Checks if restarts align with scaling
-
kubectl get jobs -n <namespace>:- Identifies failing job pods or backoff misconfigurations
Advanced Diagnostic Commands
For complex or persistent restart issues, a deeper inspection is required. These advanced commands allow real-time checks inside containers, review of node health, and collection of cluster-wide diagnostics.
-
kubectl debug pod/<pod-name> -it --image=busybox:- Launches an ephemeral debug container for checks inside the namespace
-
kubectl exec -it <pod-name> -- /bin/sh:- Opens a container shell to verify the filesystem or processes
-
kubectl get node <node-name> -o yaml:- Surfaces node conditions like
DiskPressureorMemoryPressure
- Surfaces node conditions like
-
kubectl cluster-info dump | grep -i error:- Collects cluster-wide diagnostics to spot API or scheduler issues
-
kubectl get endpoints <service-name>:- Confirms service backends
- Missing endpoints often break readiness probes
Step-by-Step Restart Investigation Workflows
Pod restarts require a structured investigation. Random commands waste time and often miss root causes. A systematic pod restart investigation workflow enables consistent troubleshooting, faster resolution, and clear documentation for post-incident reviews.
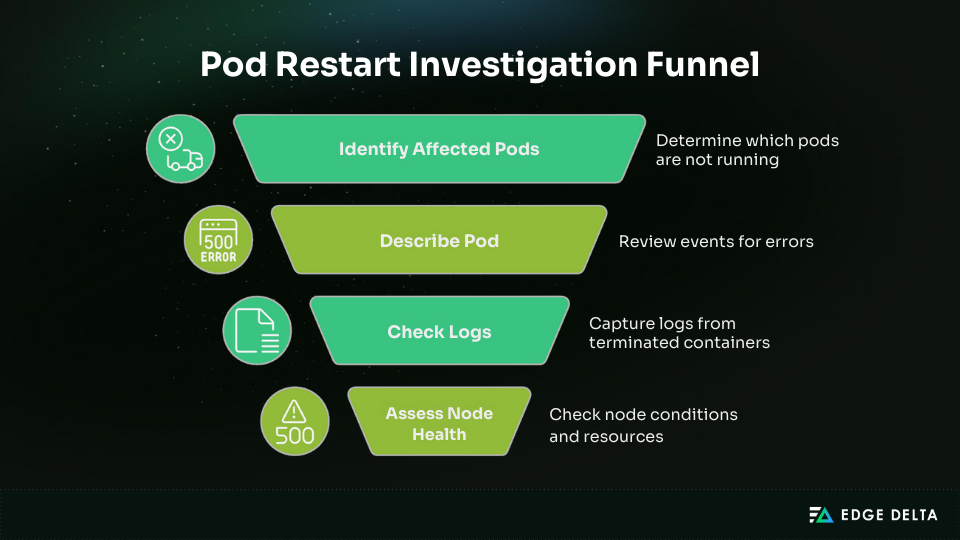
Emergency Production Triage Workflow
When production pods restart unexpectedly, speed is critical. The first priority is restoring service availability while still collecting evidence for later investigation.
Steps
1. Identify affected pods: This quickly surfaces pods that are not in a Running state.
kubectl get pods -n <namespace> --field-selector=status.phase!=Running2. Describe the pod: Review events for OOMKilled, FailedScheduling, or probe failures.
kubectl describe pod <pod-name>3. Check logs: Use --previous to capture logs from the last terminated container.
kubectl logs <pod-name> -c <container-name> --previous4. Assess node health: Check for memory pressure, disk pressure, or node condition changes.
kubectl
describe node <node-name>
Decision Path
- Resource exhaustion → scale replicas or increase limits
- Misconfiguration → roll back deployment
- Dependency failure → escalate to the relevant service team
Escalation Criteria: If multiple critical workloads are affected, immediately involve the SRE or platform team.
Memory and Resource Restart Investigation
Many restarts stem from memory pressure (OOMKilled) or CPU throttling. The workflow below should be used to determine if this is the case and resolve the issue.
Workflow
1. Confirm termination reason:
kubectl describe pod <pod-name> | grep -A5 "Last State"2. Check resource metrics:
kubectl top pod <pod-name>
kubectl top node <node-name>
3. Inspect resource limits in the manifest:
kubectl get pod <pod-name> -o yaml | grep -A5 resources:Decision Path
- Consistent
OOMKilled→ raise memory limits or optimize code - Node under pressure → redistribute workloads or add capacity
Example
- Finding:
Reason: OOMKilled, Exit Code: 137 - Resolution: Increased memory limit from
512Mito1Gi
Escalation Criteria: If cluster-wide memory pressure is observed, escalate to infrastructure engineers for scaling.
Application Crash Loop Analysis
Pods stuck in CrashLoopBackOff typically point to application-level issues. The workflow below should be used to determine the root cause and resolve the issue.
Workflow
1. Check restart count:
kubectl get pod <pod-name> -o
 jsonpath='{.status.containerStatuses[0].restartCount}'
2. Review previous logs:
kubectl logs <pod-name> --previous3. Inspect liveness/readiness probes:
kubectl get pod <pod-name> -o yaml | grep -A5 livenessProbeDecision Path
- Code error → escalate to the application team
- Probe misconfiguration → tune intervals and thresholds
- Missing environment variable → validate configuration and secrets
Example
- Finding:
Error: Cannot connect to database at DB_HOST - Resolution: Re-applied the missing secret and redeployed.
Escalation Criteria: Escalate to developers if code-level or application logic issues are identified.
Infrastructure and Node Issue Workflows
Restarts may stem from node instability. Following the workflow below will enable you to determine the source of the issue and resolve it quickly.
Workflow
1. Check node status:
kubectl get nodes
kubectl describe node <node-name>
2. Inspect system pods:
k
ubectl get pods -n kube-system
3. Review cluster events:
kubectl get events --sort-by=.metadata.creationTimestampDecision Path
- Node pressure → drain and reschedule pods
- Hardware/network failure → escalate to the infra team
Example
- Finding:
Warning Evicted: Pod evicted due to node pressure - Resolution: Expanded node pool and applied pod anti-affinity rules.
Escalation Criteria: Escalate if multiple nodes exhibit pressure or failures persist after rescheduling.
Dependency Failure Analysis
Some restarts occur due to external service outages. Follow the workflow below to troubleshoot such an issue.
Workflow
1. Check logs for errors:
kubectl logs <pod-name>2. Test connectivity:
kubectl exec -it <pod-name> -- curl http://db-service:54323. Review readiness probes for premature restarts.
Decision Path
- Dependency outage → escalate to the service owner
- Misconfigured retries/timeouts → adjust application logic
Example
- Finding:
Error: Timeout connecting to payment-service - Resolution: Increased timeout and implemented a circuit breaker pattern
Escalation Criteria: If the dependency is business-critical, escalate immediately to cross-functional response teams.
Interpreting Pod Events and Logs
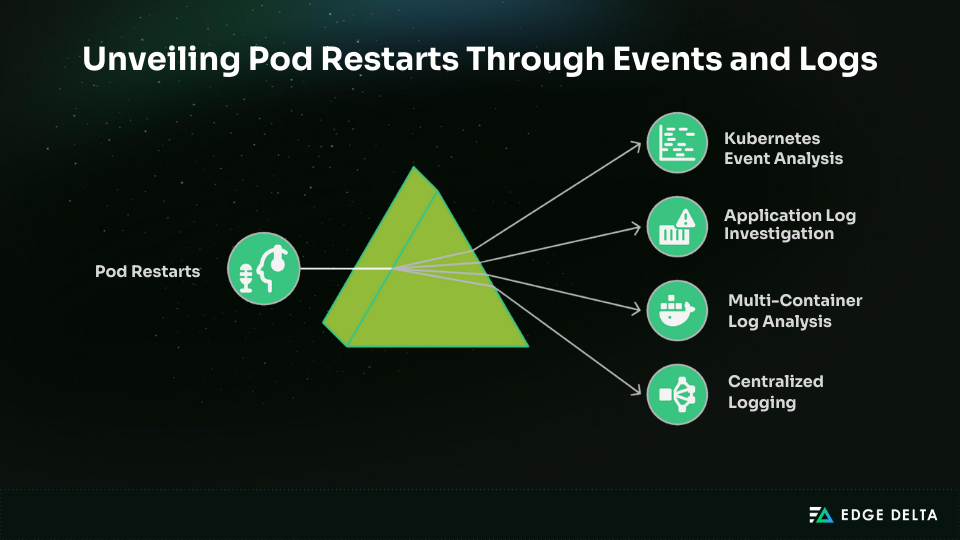
Understanding pod restarts requires analyzing both events and logs. Events show what happened and when, while logs explain why. Together, they provide the full restart story.
Kubernetes Event Analysis
Events signal lifecycle changes such as Killing (container terminated), FailedScheduling (insufficient resources), or BackOff (repeated failures). You can inspect pod events with these commands:
kubectl describe pod <pod-name>
kubectl get events --namespace <ns>
Search the surfaced events for repeating messages like BackOff (crash loops) or warnings about node pressure. Events reveal sequence and timing, narrowing the investigation quickly.
Application Log Investigation
Events explain symptoms, but logs expose causes. Crash loops may show stack traces or failed probes, while memory issues reveal OOM errors or heap dumps. Normalizing log types and formats ensures errors are easier to parse and compare across workloads.
To capture logs from the last terminated container, use this command:
kubectl logs <pod-name> --previousThe --previous flag is crucial because it retrieves logs from the last terminated container, ensuring you capture failure details that triggered the restart.
Multi-Container Log Analysis
Pods with multiple containers add complexity since each container may fail differently. A sidecar could show network errors, while the main container reports memory exhaustion. Reviewing all container logs ensures you capture every relevant perspective of the failure and helps builds a more accurate picture of restart causes.
Centralized Logging for Restart Patterns
Analyzing a single pod isn’t enough in distributed systems. Centralized platforms aggregate logs cluster-wide, correlating pod events, errors, and infrastructure signals. This aggregation is crucial, as 38% of teams struggle to extract meaningful insights from log data.
Centralized logging strengthens Kubernetes monitoring by turning scattered logs into system-wide visibility. Tools like Edge Delta enrich and normalize logs at scale, making root causes easier to pinpoint.
Common Restart Scenarios and Solutions
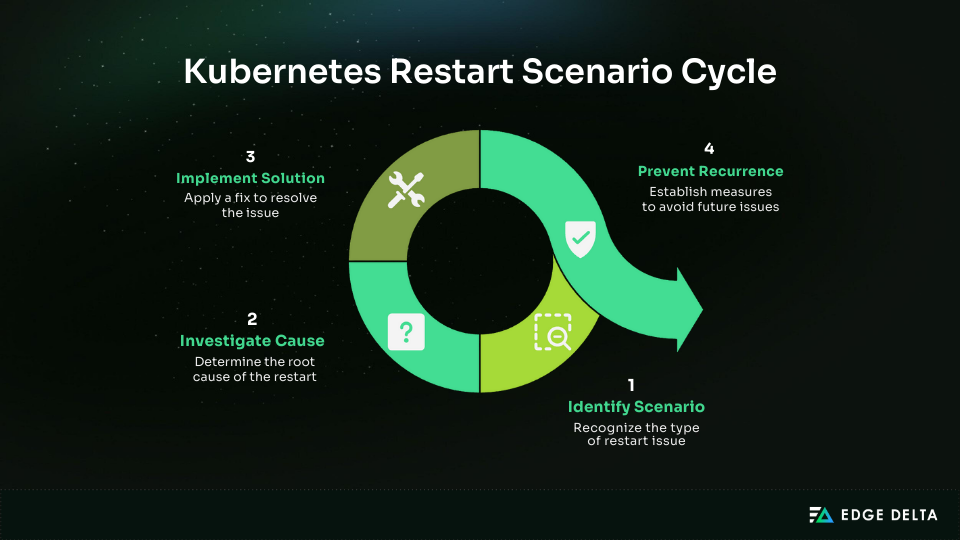
Real-world restart scenarios provide practical insight into diagnosing pod failures. Studying these cases helps teams shorten investigation time and prevent recurrence. Below are six common restart scenarios, each with symptoms, investigation steps, root causes, and solutions.
Memory and Resource-Related Restart Scenarios
Resource-related restarts usually occur when workloads exceed memory, CPU, or disk limits. They often appear as OOMKilled events or eviction messages. Checking usage early helps confirm whether the issue is application- or node-related.
Memory Limit Exceeded (OOMKilled due to Memory Leak)
Pods hitting memory limits often restart with OOMKilled status.
Last State:   Terminated
Reason:       OOMKilled
Exit Code:    137
Investigation:
kubectl top pod- Check
resources.limits.memoryin spec - Review logs
Root cause: Memory leak exhausted container memory.
Resolution:
- Raise memory limit (short term)
- Profile for memory leaks
- Right-size requests/limits
- Add Prometheus alerts (long term)
Node Resource Pressure (Disk Pressure Causing Eviction)
Pods may also be evicted when nodes run out of disk space.
Investigation:
kubectl describe node- Run
df -h - Check logs/ephemeral storage
Root cause: Disk full from log growth or unused images.
Resolution:
- Clear unused files and reschedule workloads (short term)
- Add log rotation, ephemeral storage limits, and larger nodes (long term)
Health Check and Probe Failure Scenarios
Probe misconfigurations often trigger CrashLoopBackOff states, usually from incorrect endpoints, ports, or timeouts. Validating probe settings can prevent unnecessary restarts.
Misconfigured Liveness/Readiness Probe
Probes that fail repeatedly trigger restarts.
Liveness probe failed: HTTP probe failed with statuscode: 404Investigation:
- Review probe config in YAML
kubectl exec curlendpoints- Confirm timeouts
Root cause: Probe pointed to /status instead of /health.
Resolution:
- Fix probe path and redeploy (short term)
- Standardize endpoints and use startup probes for slow apps (long term)
Configuration and Dependency Restart Scenarios
Misconfigurations and dependency failures often appear during deployments. They typically manifest as immediate startup crashes or repeated restarts when external services are unavailable.
Invalid Environment Variables or Missing Secrets
Pods crash when required environment variables or secrets are missing.
FATAL: Missing required environment variable DB_PASSWORDInvestigation:
- Inspect pod spec
- Check
envFrom/secretKeyRef - Verify secrets with
kubectl get secret -o yaml.
Root cause: Missing or deleted secret left pod without credentials.
Resolution:
- Recreate the secret and restart the pod (short term)
- Enforce RBAC, validate in CI/CD, or use external secret managers (long term)
Database Connection Failures (External Dependency)
Pods depending on databases often restart if connections fail.
java.sql.SQLException: Connection refused (db-service:5432)Investigation:
kubectl exec nc db-service 5432- Confirm DNS resolution
- Check DB logs
Root cause: The database hit max connections.
Resolution:
- Restart DB or scale pools (short term)
- Add pooling, monitoring, and retries/circuit breakers (long term)
Image Pull Failures (Registry Authentication or Network Issue)
Pull failures block pods from starting, leaving them in ImagePullBackOff.
Failed to pull image "registry/myapp:v2": unauthorizedInvestigation:
- Check
imagePullSecrets - Verify credentials
- Test
docker pull
Root cause: The container has expired or invalid registry credentials.
Resolution:
- Update secrets (short term)
- Automate secret refresh and monitor image pull events (long term)
Pod restarts often stem from resource limits, probe errors, misconfigurations, or dependency failures. Recognizing these patterns enables quick fixes and long-term safeguards, improving Kubernetes reliability.
Proactive Monitoring and Prevention
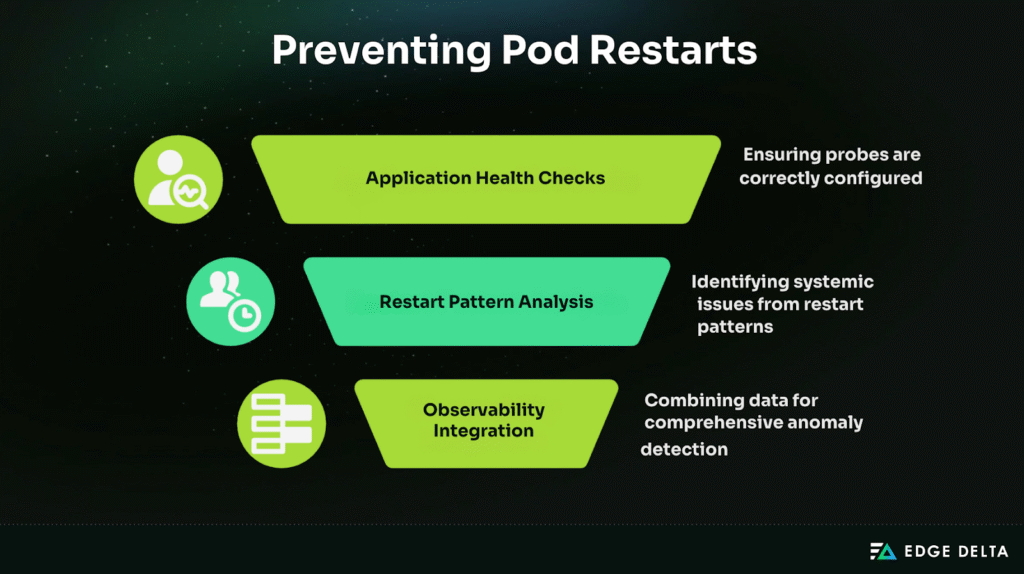
Pod restarts are usually symptoms, not root causes. Preventing them requires proactive monitoring, predictive alerting, and resilience strategies. By tracking resources, application health, and restart patterns, teams can address problems before they escalate into outages.
Resource Monitoring and Trending
Most restarts stem from resource limits like memory leaks, CPU throttling, or disk pressure. Tools such as Prometheus or kubectl top provide insights.
- Monitor key metrics (memory, CPU, disk I/O, ephemeral storage)
- Alert at safe thresholds (e.g., 80% memory) to prevent
OOMKilledevents - Use rolling averages to catch abnormal growth like memory leaks
Application Health and Resilience
Misconfigured probes often cause false restarts. To prevent this, you should follow these best practices:
- Tune probe intervals and timeouts
- Apply resilience patterns (retries, backoff, graceful shutdowns)
- Monitor external dependencies (APIs, databases)
Restart Pattern Analysis
Single restarts may be harmless, but frequent or clustered ones often signal systemic issues. Monitoring patterns helps teams separate noise from real risks.
- Alert on patterns (e.g., >3 restarts in 10 minutes)
- Track historical trends across workloads
- Distinguish normal updates from failures
Observability Integration
Unified telemetry pipelines — such as those provided by platforms like Edge Delta — bring logs, metrics, and traces together into a single stream for anomaly detection and cross-signal correlation. Gateway pipelines extend this approach by routing related data to the same replica, improving aggregation accuracy and reducing coordination overhead. By consolidating signals at the pipeline level, teams can design for resilience more effectively while minimizing data shuffling. The result is stronger system reliability, fewer firefighting cycles, and lower monitoring costs through efficient edge processing.
An SRE Teammate takes this further by actively investigating pod restart events — correlating logs and metrics to identify the underlying cause and suggest remediation steps.
Advanced Troubleshooting Techniques
Complex Kubernetes restart scenarios often need more advanced methods than basic kubectl logs. Effective troubleshooting blends pod-level inspection with node and cluster investigations, supported by external tools.
Debug Containers and Advanced Pod Inspection
When restart causes are unclear, ephemeral debug containers (Kubernetes v1.18+) provide visibility without disrupting workloads. They allow inspection of filesystems, network settings, and runtime processes.
When debugging restarts, teams should also check init container errors, probe logs, and runtime mismatches. In some setups, using emptyDir-based log capture provides a fallback way to preserve short-lived logs.
Commands like kubectl describe pod --previous reveal terminated container details that speed diagnosis.
Node-Level and System Restart Investigation
Some restarts stem from node-level issues such as kernel exhaustion, disk pressure, or kubelet crashes. Tools like journalctl -u kubelet, dmesg, and kubectl describe node expose OOM events, hardware errors, or network drops.
Reviewing container runtime logs (using, e.g., containerd, or CRI-O) uncovers restart triggers outside Kubernetes’ direct visibility.
Cluster-Wide Restart Pattern Analysis
Widespread restarts often link to configuration rollouts, API server instability, or etcd failures. Start with kubectl get events --sort-by=.lastTimestamp, then review control plane logs and component health.
Tools like Prometheus and Grafana can help correlate restart spikes with metrics, while observability platforms connect logs, metrics, and traces across clusters. This risk isn’t theoretical, as 51% of Kubernetes cluster-wide failures stem from state-replication errors. Restarting pods can quickly escalate into full-cluster outages.
Restart Investigation Best Practices
Successful troubleshooting extends beyond technical commands, drawing on defined processes, team collaboration, and ongoing learning to reduce downtime and improve resilience.
Incident Response
Unexpected restarts require triage to assess severity and impact, whether isolated, service-wide, or cluster-wide. Standard procedures ensure the systematic collection of logs, events, and metrics.
Clear escalation paths and coordinated communication (e.g., Slack, PagerDuty) align DevOps, SREs, and developers for faster recovery.
Documentation and Knowledge Sharing
Every incident should be documented with symptoms, diagnostic steps (kubectl describe pod, kubectl get events), root causes, and fixes. Converting this into runbooks or knowledge base entries builds repeatable guidance.
Centralized tools like Confluence or Git repositories improve knowledge access and pattern recognition across teams.
Post-Incident Analysis
Blameless reviews identify causes, evaluate response speed, and assess SOP effectiveness. Findings should drive monitoring improvements, resource right-sizing, and better probe configurations. Consistent analysis lowers MTTR and strengthens platform reliability over time.
Conclusion
Pod restarts are a normal part of Kubernetes operations, but frequent or unexplained restarts often point to deeper problems. Relying on ad hoc troubleshooting wastes time and risks overlooking the real root cause.
A structured approach transforms how teams investigate restarts — reducing mean time to recovery (MTTR) and preventing repeat failures. Research shows that structured incident response can cut MTTR by as much as 50%. Applying the same discipline to pod restarts accelerates recovery and helps avoid cascading outages.
Shifting from reactive fixes to systematic troubleshooting builds team confidence and leads to more resilient, stable Kubernetes environments. Edge Delta’s SRE Teammate brings that systematic approach to Kubernetes operations — automatically correlating pod restart events with logs and metrics to surface root cause without manual investigation.
Frequently Asked Questions
Why do my Kubernetes pods keep restarting, and how can I find out why?
Your pods may be restarting due to resource contention, which happens when multiple pods compete for limited CPU or memory. This can occur if the node doesn’t have enough resources or if resource requests and limits are misconfigured, causing inefficient distribution.
What’s the difference between pod restart and pod recreation?
Since the pod is just restarted rather than deleted and regenerated, the pod ID doesn’t change. The pod’s status changes from Running to Terminating and then back to Running. The pod data is kept intact unless the pod specification or image has changed.
How do I check pod restart history and patterns?
Check restarts with kubectl get pods (restart counts) and kubectl describe pod <pod> (events to provide context). Inspect old logs using kubectl logs <pod> --previous. For patterns across clusters, use monitoring tools like Prometheus or Kubernetes dashboards.
References
- Perfect Scale
- Fairwinds
- Kubernetes
- Medium
- Kubernetes
- Medium
- Kubernetes
- Medium
- Komodor
- Spacelift
- Groundcover
- Kubernetes Pod Cycle
- Groundcover
- Kubernetes Logging Architecture
- Spacelift
- Groundcover
- Lumigo
- Last9
- Devtron
- LogicMonitor
- Medium
- Medium
- Getambassador
- SRE
- Sysdig
- Groundcover
- Refine
- Plural
- Kubernetes

