Introduction
Similar to other cloud providers, Azure has a serverless solution called Azure Functions which makes it effortless to run event driven workloads without the need to manage infrastructure and worry about scalability. It also has built-in integration for ingesting all the logs/metrics/traces to Application Insights. This is easy to implement and convenient but as we all know – there’s no such thing as free lunch.
The cost of Application Insights can quickly grow beyond even the most reasonable expectations if you have a fair amount of telemetry data. In many cases Application Insights cost can grow to over 2,000% of the function execution cost. Due to this substantial monitoring cost, fully serverless architecture can be prohibitively expensive. In this blog we explore how using distributed processing of the data can help.
At Edge Delta, we believe in generating actionable insights/alerts tailored to improve the experience of DevOps engineers without having to pay an arm and a leg to shove all of the raw data into a centralized management system first (the traditional way).
Edge Delta is a platform optimized for:
- Stream pre-processing data at the source (where it’s generated)
- Extracting valuable information from large data sets in a performant manner
- Generating actionable insights/alerts with minimal required configuration
- Dynamically routing data to optimal streaming and trigger destinations
- Natively integrating with monitoring tools (most observability platforms are supported)
In the previous decade, the concept of a data lake was popular – a location where you send all your data irregardless of its native format or schema and have batched queries to derive insights. As many on the Edge Delta platform have mentioned, this strategy of centralizing all raw telemetry data into a high-cost monitoring solution is quickly becoming more and more prohibitive from both a cost and technical perspective. Couple this with the exponential growth in data generation with the adoption of distributed microservice architectures, or serverless architectures such as Azure Functions, the raw data challenge is bringing many organizations to an inflection point.
This blog post will go into details of how to monitor Azure Functions with Edge Delta and reduce your cost drastically. We support monitoring other environments like Kubernetes, EKS, GKE, AKS, ECS, EC2, Windows etc. If your infrastructure is deployed to any of these environments feel free to reach out or sign up for free at app.edgedelta.com and follow easy deployment steps.
Dynamic Tracing Overview
In a typical setup, Azure Functions are configured with a target Application Insight connection string and the telemetry data is sent to Application Insight directly by Azure Function. Application Insights supports three different types of sampling out of the box: adaptive sampling, fixed-rate sampling, and ingestion sampling. These might work for some use cases but none of them supports the smart tail sampling which is provided by the Edge Delta Dynamic Tracing feature. Edge Delta intercepts Application Insight calls made by Azure Functions and applies smart filtering such as:
- Ingest failed operation events
- Ingest high latency operation events
- Ingest samples of the successful events
- Ingest events filtered by any user-defined telemetry attribute. e.g. custID, clientIP etc.
This approach strives to be the best of both worlds – you still have your high value operation traces as well as sample data from low value operations to do statistical analysis, correlation, and see how data may be anomalous compared to historical baselines. This allows you the opportunity to scale orders of magnitude higher as the resulting data sets in Application Insight is a fraction of the telemetry data that would otherwise be generated.
For the cases where a historical data might be needed, Edge Delta is also able to be configured to archive the raw data in cold storage such as Azure Blob Archive tier, Snowflake, or S3. There is also an option to make the cold storage queryable on demand via our web application.
Side Note:
Besides this smart filtering capability, Edge Delta is able to generate operational metrics from the intercepted telemetry data such as overview metrics, failure counts, latency percentiles etc. These metrics are processed in real time by Edge Delta to detect patterns, anomalies, and negative sentiments.
The generated metrics/insights/alerts can be visualized on our web application or can be streamed to your choice of backend including Splunk, New Relic, Elastic, Slack and many others. Visit our documentation for more details on integrations and use cases.
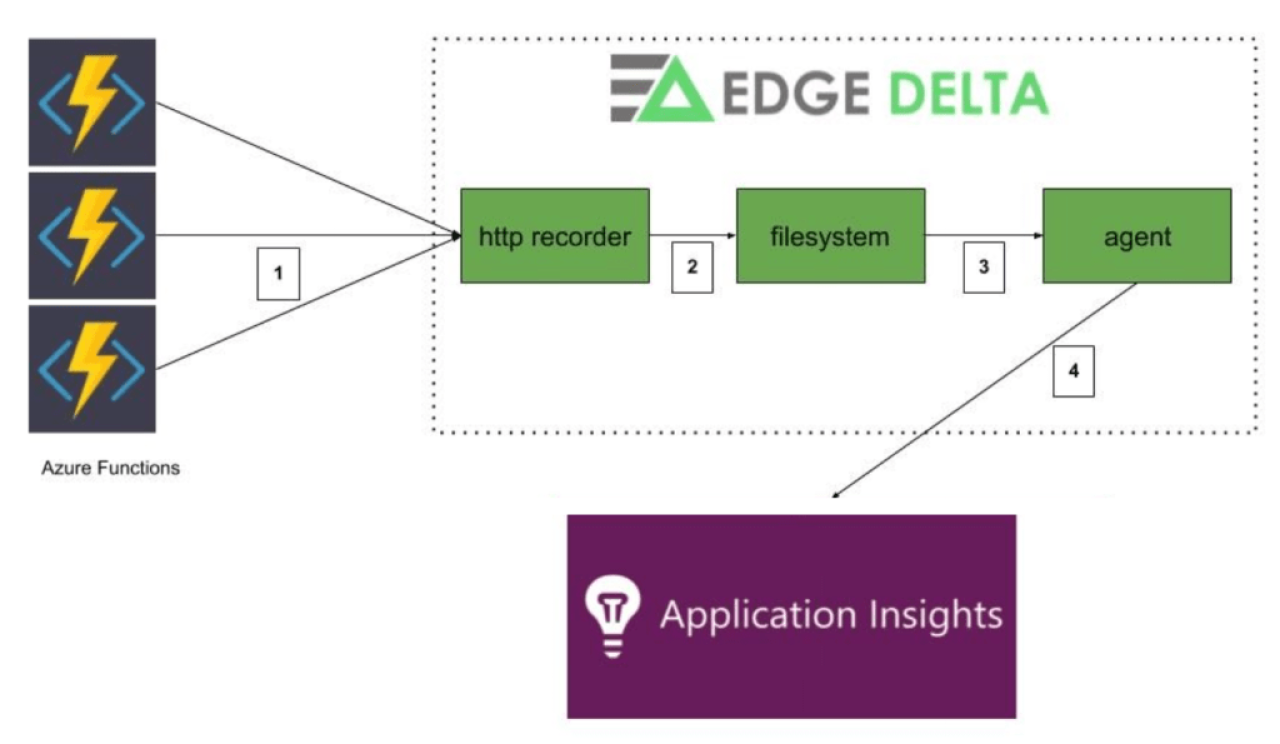
The Edge Delta Dynamic Tracing solution consists of 2 components.
- Http recorder: Listens and records telemetry data sent from Azure Functions to filesystem. This allows the platform to quickly respond to post requests.
- Agent: Processes recorded telemetry data and forwards selected trace information to Application Insights according to settings in the configuration. In addition, the configuration is able to be updated dynamically w/o downtime.

How it Works
-
Azure Functions are configured to use the Edge Delta ingestion endpoint instead of the standard Application Insights endpoints. Telemetry data is directly sent from Azure Functions to the Edge Delta processing layer using the standard telemetry SDK.
-
Edge Delta’s lightweight http recorder appends the telemetry data to json files.
-
Edge Delta agent tails the json files in real time and buffers the events in memory. A single Azure function execution may contain multiple events such as requests, traces, dependencies etc. All events are buffered for a short period of time until the agent decides to either flush (send through) or discard the execution events. Decision process is as follows:
- If the operation has failed then flush its events
- If the operation latency is greater than threshold then flush its events
- If success sampling is enabled flush/discard proportionally
- If the operation matches a user-defined attribute filter then flush its events
-
This approach gives your organization the best of both worlds; you can get full visibility into important data without having to ingest the low value raw data.
-
Edge Delta forwards the events that match the above criteria in batches. Original events that are emitted from Azure Functions will be sent to Application Insights as is.
Deploy Edge Delta Dynamic Tracing to AKS
This section explains how to deploy the Edge Delta Dynamic Tracing components to an AKS cluster which processes Azure Function events. AKS is simply one option as it is also possible on any VM with docker installed. Additionally, Edge Delta offers a managed solution for this if the preference is to forgo maintaining these infrastructure pieces. There are pros/cons with either approach but if the managed solution is preferred feel free to reach out to us.
1. Create a new config on app.edgedelta.com with content from here.
2. Replace INSTRUMENTATION_KEY and endpoint at line 37 with your application insight’s connection details.
3.Give a reasonable buffer for trace_deadline at line 30. If your function is taking at most X seconds then set trace_deadline to X + 3 seconds. This way Edge Delta will be able to capture all events of an operation and will not have to discard partial trace events when the deadline is reached
4.Create a new AKS cluster or use an existing one
5. Add a new node pool on AKS with below spec:
name: processors
OS: linux
size: 1
6. When the cluster is ready, connect to it and create Edge Delta API Key secret. This is your Edge Delta configuration id created at step 1.
kubectl create namespace edgedelta
kubectl create secret generic ed-api-key
    –namespace=edgedelta
    –from-literal=ed-api-key=”c40bafd5-xxxxxxx”
7. In order to support tls connections we will create Kubernetes ingress resources as described here.
Note: This step requires Helm.
kubectl create namespace ingress-basic
helm repo add ingress-nginx https://kubernetes.github.io/ingress-nginx
helm install nginx-ingress ingress-nginx/ingress-nginx
    –namespace ingress-basic
    –set controller.replicaCount=1
    –set controller.nodeSelector.agentpool=processors
    –set defaultBackend.nodeSelector.agentpool=processors
8. Get IP address
kubectl –namespace ingress-basic get services -o wide -w nginx-ingress-ingress-nginx-controller9. Create a DNS zone on Azure portal
Note: You will need to have a public dns entry for your zone to be publicly accessible. For example if your dns zone is contoso.xyz you need to own contoso.xyz. A workaround is to create a separate AKS cluster with http application routing enabled and use its dns zone. It will have public DNS records created by Azure. e.g. 12345.centralus.aksapp.io.
10. Create an A record “ingest.edgedelta” within your DNS zone using Azure portal and point it to the IP address of ingress controller.
ingest.edgedelta. ->11. Install cert-manager
kubectl label namespace ingress-basic cert-manager.io/disable-validation=true
helm repo add jetstack https://charts.jetstack.io
helm repo update
helm install
    cert-manager
    –namespace ingress-basic
    –version v0.16.1
    –set installCRDs=true
    –set nodeSelector.”beta.kubernetes.io/os”=linux
    jetstack/cert-manager
12. Download Edge Delta dynamic tracing Kubernetes resource definition file
Make following modifications:
- If you skipped step 6 then update the nodeSelector accordingly
- Update the host values in edgedelta-ingress resource with ingest.edgedelta.your.dns.zone
13. Apply the yaml file
kubectl apply -f ed-appinsights-trace-processor.yaml14. Verify edgedelta pod is running
kubectl get pods -n edgedelta15. Verify certificate creation (required for https communication)
kubectl get certificate –namespace ingress-basic16. Verify public endpoint is accessible without any certificate warnings in a browser
https://ingest.edgedelta.your.dns.zone
17. Now that our AKS deployment is ready to take traffic let’s configure the application insight connection string of the Azure Function you would like to test with
“APPLICATIONINSIGHTS_CONNECTION_STRING”: “InstrumentationKey=***;IngestionEndpoint=https://ingest.edgedelta.your.dns.zone”,18. Trigger the Azure Function by simulating a failure case and also a few times successfully. Verify the target Application Insight only has the failed operation events.
The default agent configuration will also consider traces whose duration exceeds 3000ms. If your function is taking longer than this its events should also be forwarded to Application Insight.
19. Operation event filtering/tracing is just the tip of the iceberg. Visit our documentation to read more about Edge Delta’s capabilities.
Conclusion
As you’ve seen in this post – it is possible to use a more dynamic approach to logs, metrics, and traces that leads to significant technical and financial benefits. The outdated way of waiting until all data is indexed in a data lake prior to starting analysis was an approach that was optimized when data volumes were relatively quite small. There are many on the Edge Delta platform that are using these approaches to reduce their observability costs by more than 95% while also achieving new and improved technical capabilities with faster and more advanced insights.
Thanks for reading up to this point! If you can’t tell, we’re passionate about this space. If the solution explained in this post is not optimal for your use case for any reason feel free to reach out to us on info@edgedelta.com. We love feedback and are always open to design partnerships. Happy Monitoring!


