If you’re a Datadog customer considering adding Edge Delta to your observability stack, you likely want to achieve one or both of the following:
- Gain better intelligence into the log data you’re creating
- Optimize the datasets you are indexing within Datadog
Datadog customers can take advantage of these benefits out of the box via Edge Delta’s pre-built integration. There are also scenarios where you might have built advanced functionality within your existing Datadog environment and need to tailor Edge Delta accordingly. For example, you might have structured logs in a purposeful way that allows your team to work more efficiently. Or, you might have enriched your logging data in a manner that allows you to correlate insights across logs, metrics, and traces.
Whatever the case, Edge Delta provides the flexibility to help Datadog customers optimize and gain better intelligence into their logging data, while complementing their existing workflows and configurations. In this blog post, we’ll walk through a couple of examples detailing how.
Understanding How Edge Delta Augments Datadog
Before diving into the functionality that Edge Delta provides to Datadog customers, there are a few essential concepts to grasp. The first concept to break down is Datadog’s Log Management pricing model, since it has a direct impact on the value we’re able to offer. At a high level, Datadog charges:
One small fee based on the sheer volume of data ingested into the platform
Another larger fee per million of log events retained or rehydrated (this is important and something we will revisit shortly)
The other prerequisite for this discussion is understanding how Edge Delta optimizes logging data. As datasets are created at the source, Edge Delta determines the structure or “pattern” of each logline and clusters like patterns together. If a logline is generated that fits an existing pattern, the count increases by one. If a net new log pattern is created, it increments to ‘1’ total. From there, metrics are created off of each log pattern.
Within the Patterns screen of the Edge Delta UI, customers can see…
- Each new log pattern that is generated
- The number of instances that this pattern has occurred (“Count”)
- The change in activity over the last 10 minutes vs. the previous ten (“Delta P.P.”)
- The sentiment of the pattern (negative or neutral)
All of this data is generated automatically as soon as logs pass through Edge Delta, making it simple to understand service health and quickly spot changes in behavior.
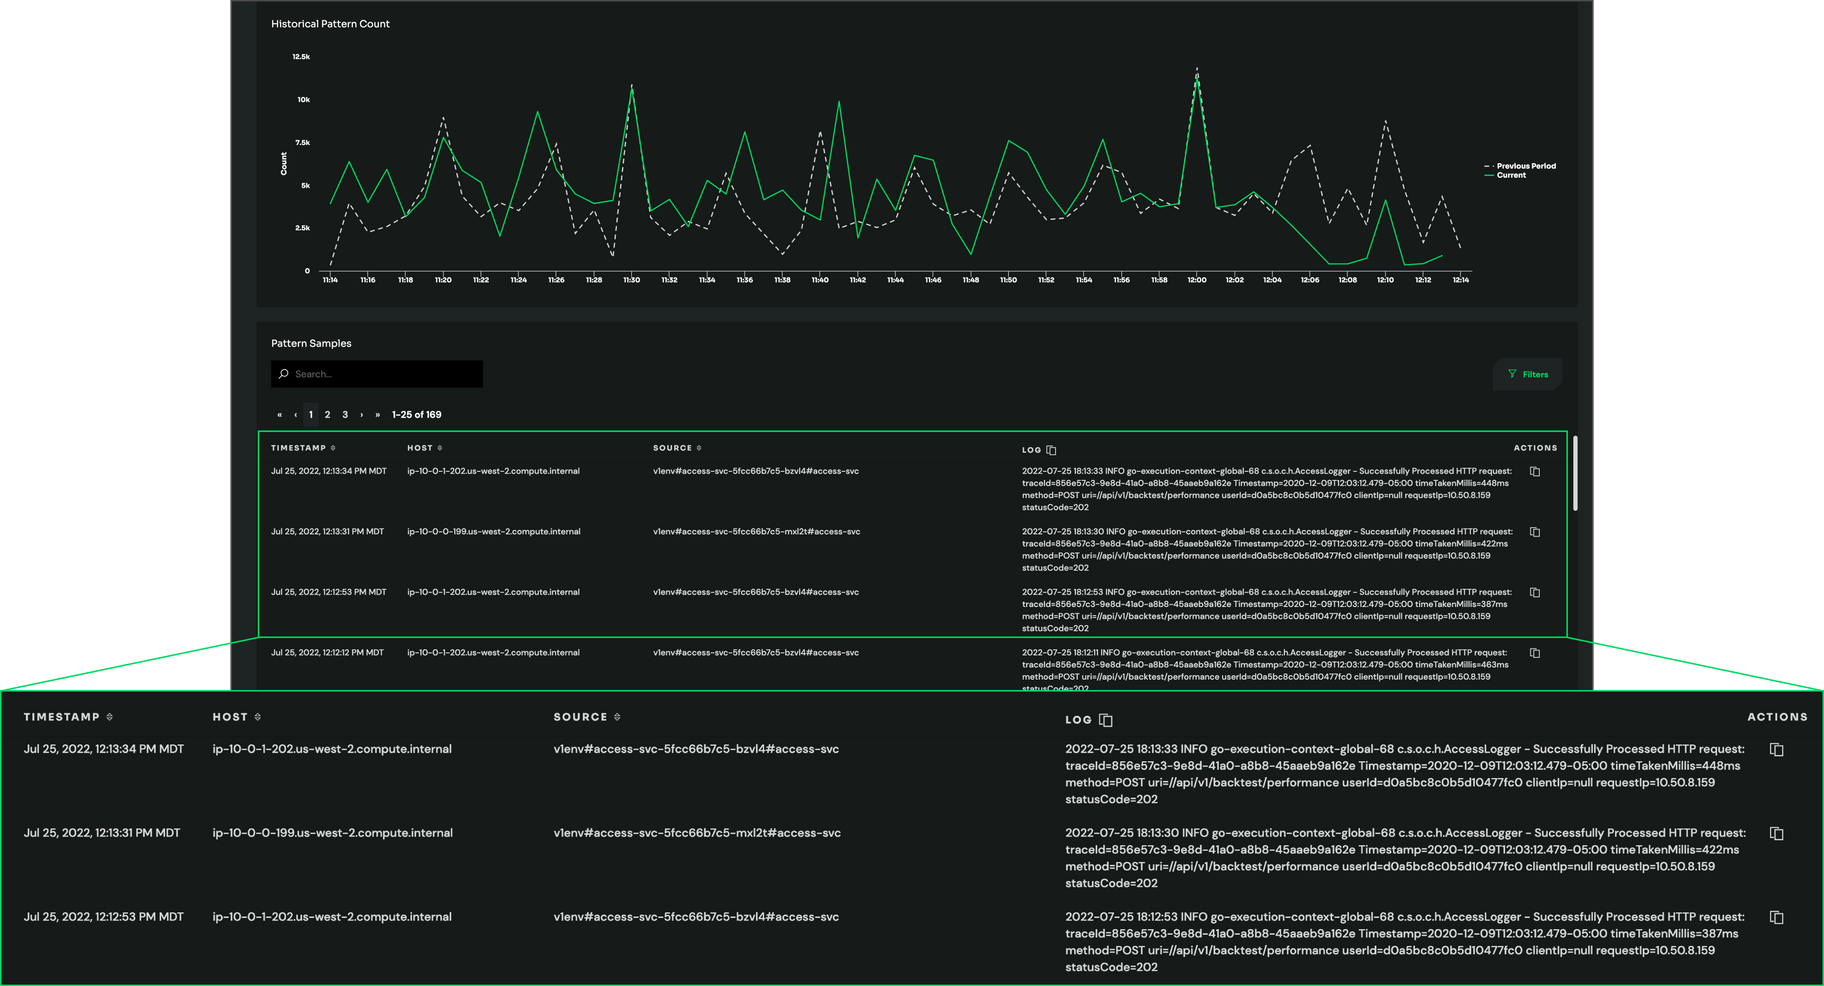
As Edge Delta builds patterns, it also captures Cluster Samples – sample log events that demonstrate which raw logs are contributing to a pattern. Cluster Samples are captured at predetermined intervals.
Reduce Index Volumes in Datadog
Now, let’s apply this functionality to a Datadog environment. Since the bulk of a customer’s Datadog bill will come from the number of log events indexed, you’ll likely want to only index loglines that are deemed important to your team.
The raw logs that make up your Pattern Samples meet these criteria, given they provide a snapshot into each unique behavior your service or application is experiencing. By indexing only Cluster Patterns and Pattern Samples, we typically see customers index 80% less data into Datadog, while also ensuring users get the data they need. Additionally, it’s worth noting that sudden spikes in service behavior often result in Datadog overages. By capturing Pattern Samples, you no longer have to index an entire “spike” when buggy code is released or if debug is left on. Instead, you get a snapshot into the behavior to avoid overages while still achieving similar visibility.
Add Deeper Intelligence Into Each New Behavior Within Datadog
That brings us to our next point. We now understand how Edge Delta can help you reduce index volumes in Datadog, but how can it provide deeper intelligence into new behaviors (like this hypothetical spike)?
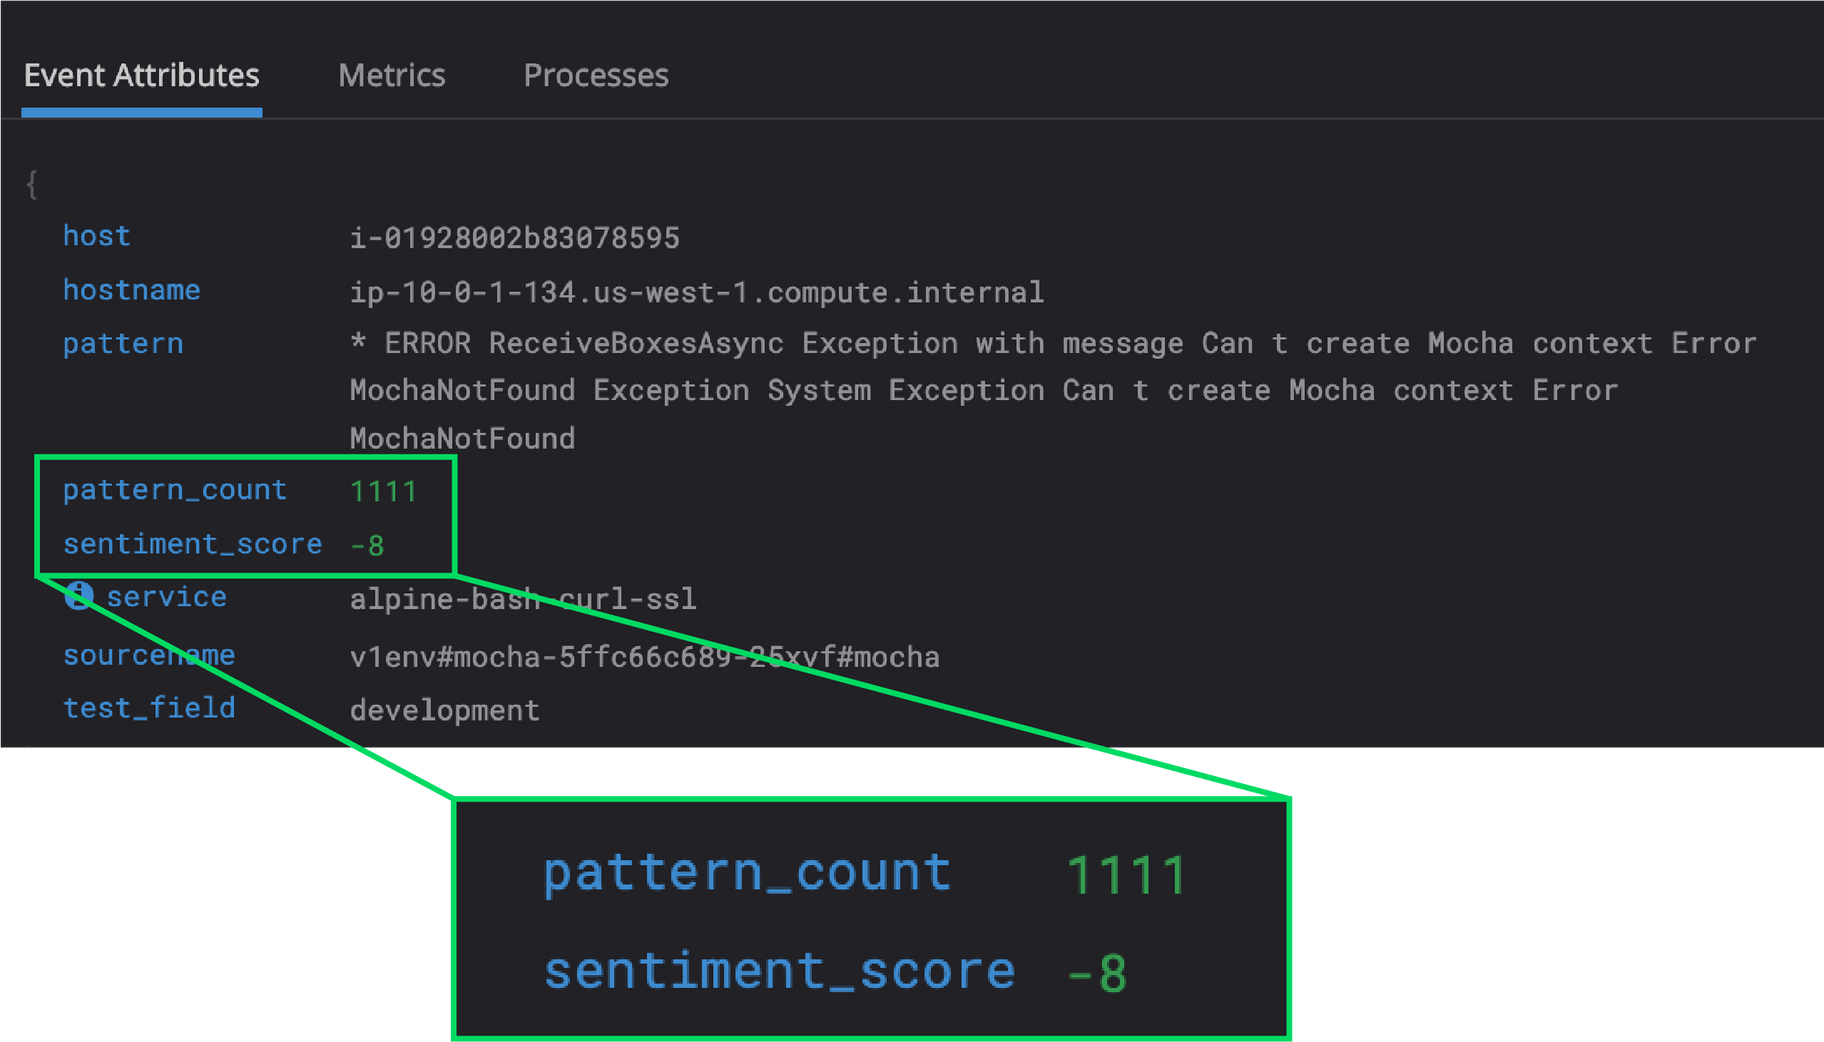
As I mentioned earlier, Edge Delta automatically generates insightful metrics off of raw log data, which is typically accessible via the Edge Delta UI. In this scenario, however, your team might be accustomed to Datadog and not want another tool to correlate insights across. In that case, Edge Delta can still give you the insights you need without adding to costs.
In your Edge Delta YAML Configuration File, denote include_pattern_info_in_samples as true in your cluster processor. By doing so, Edge Delta will include all of the metrics associated with a given pattern as attributes to your raw cluster samples. Again, since Datadog charges per log event, all of this rich context can be included at no extra cost.
Doing so will allow all your existing grok parsers to function as usual on the Edge Delta Cluster Sample (raw log).
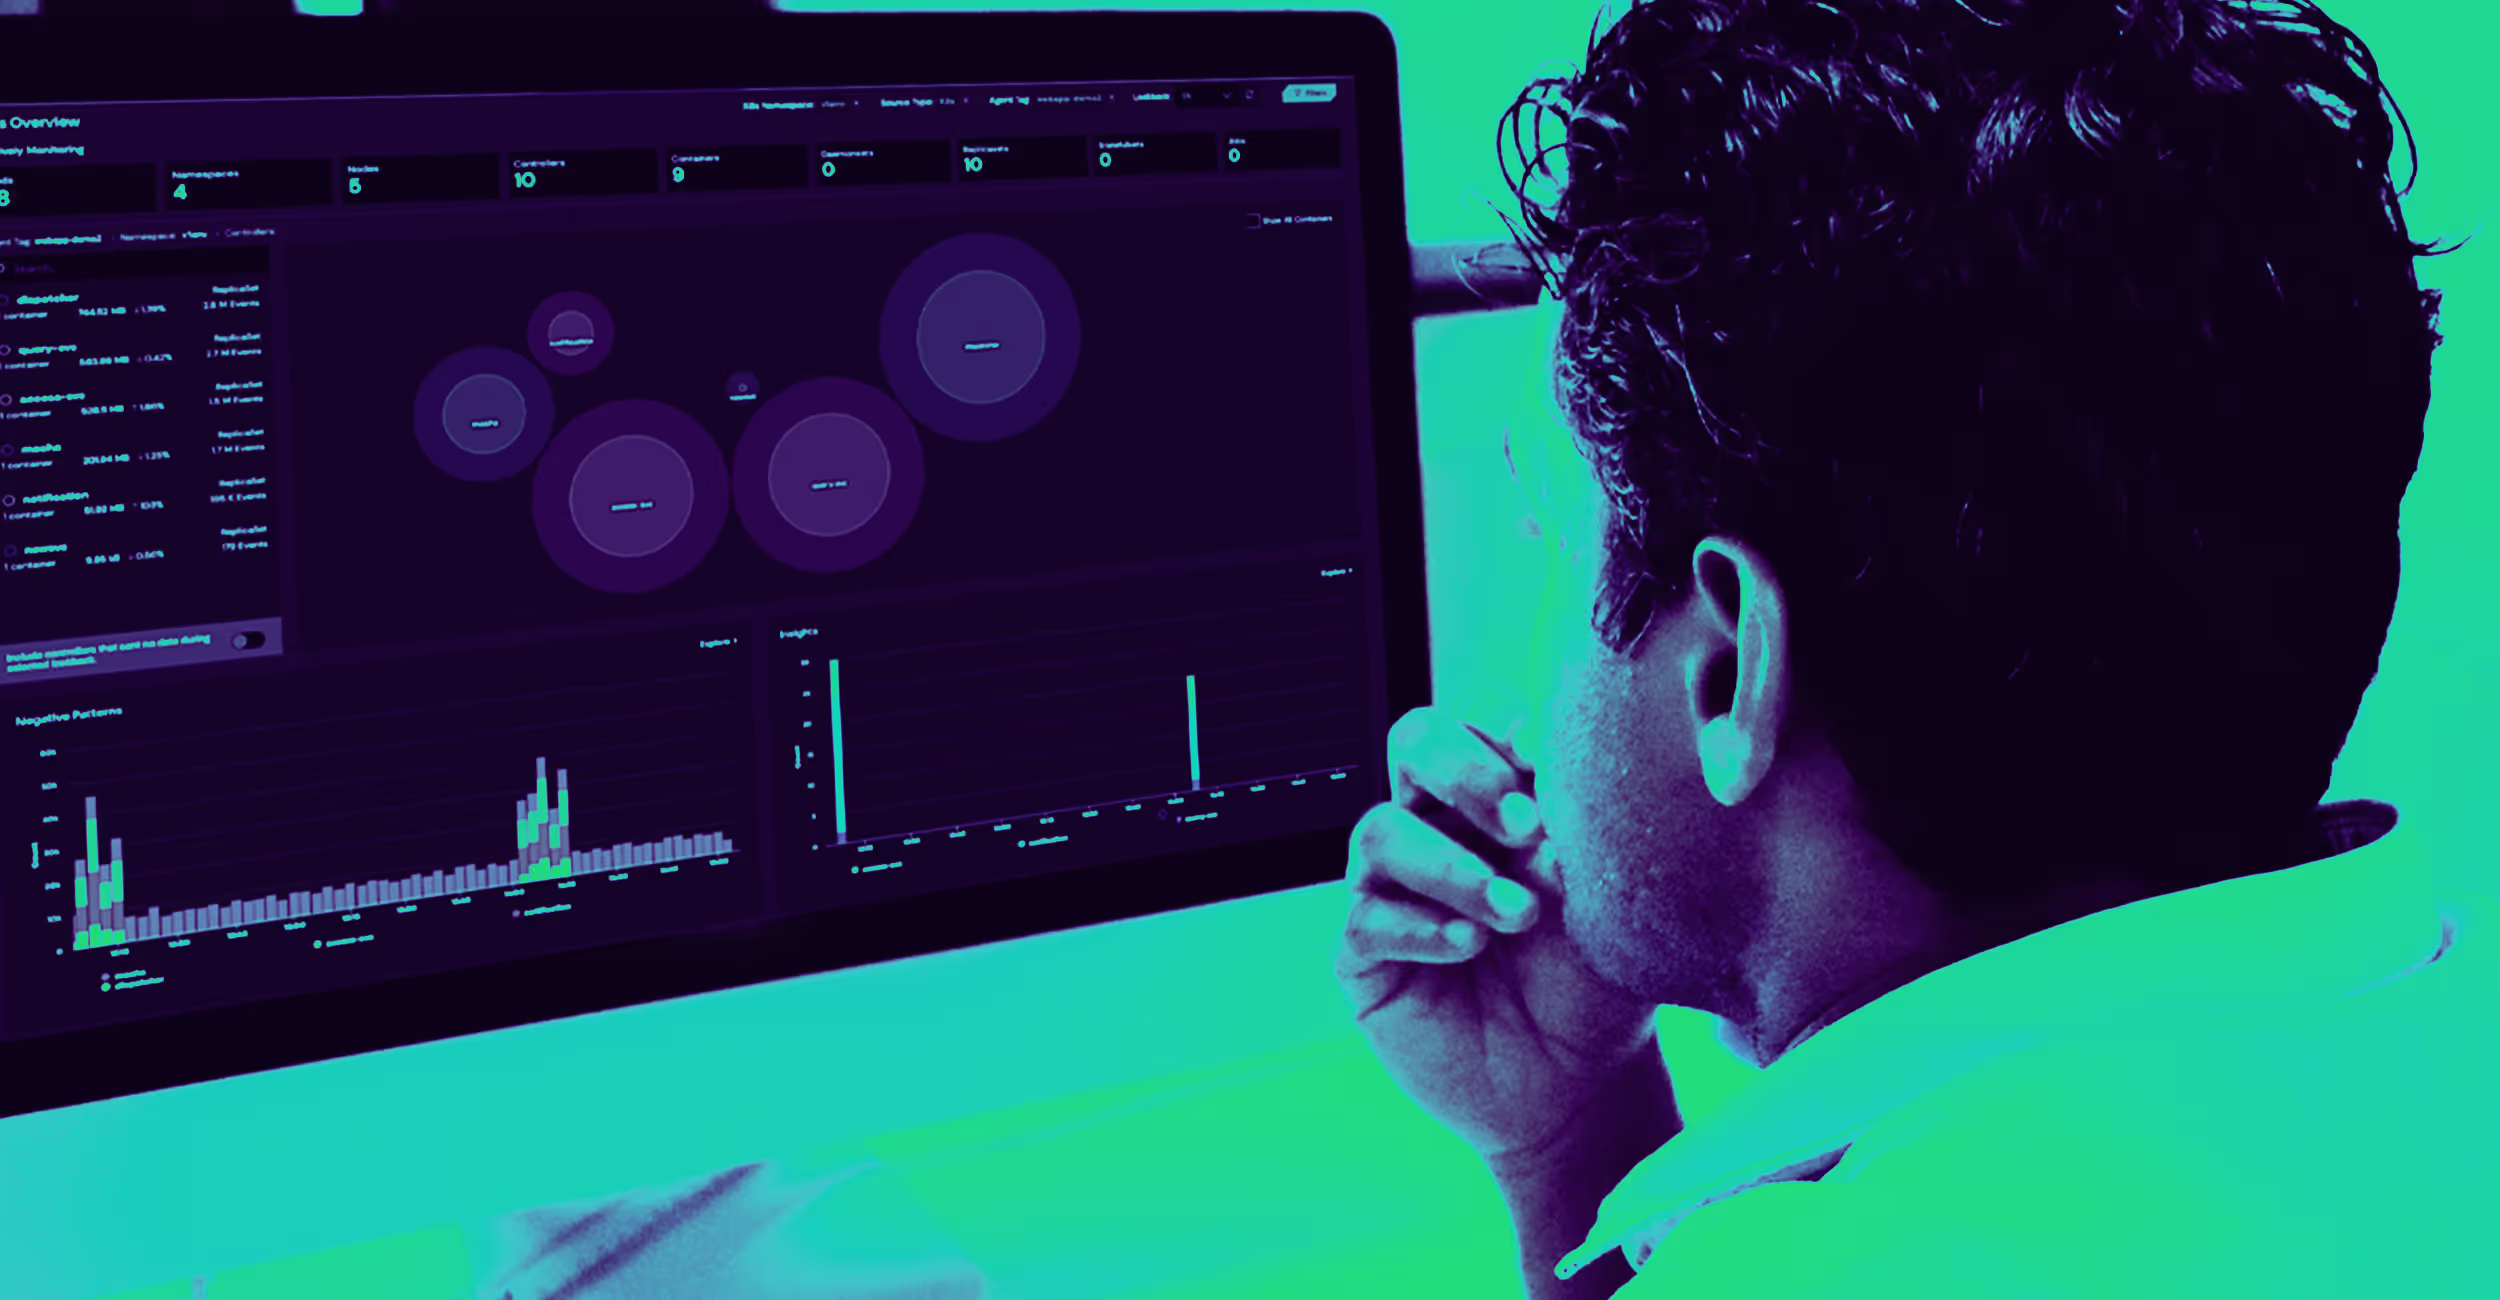
Augmenting Your Workflow With the K8s Overview
In cases where there is a spike in behavior and your team is having trouble understanding where this is occurring, the Edge Delta UI comes in handy.
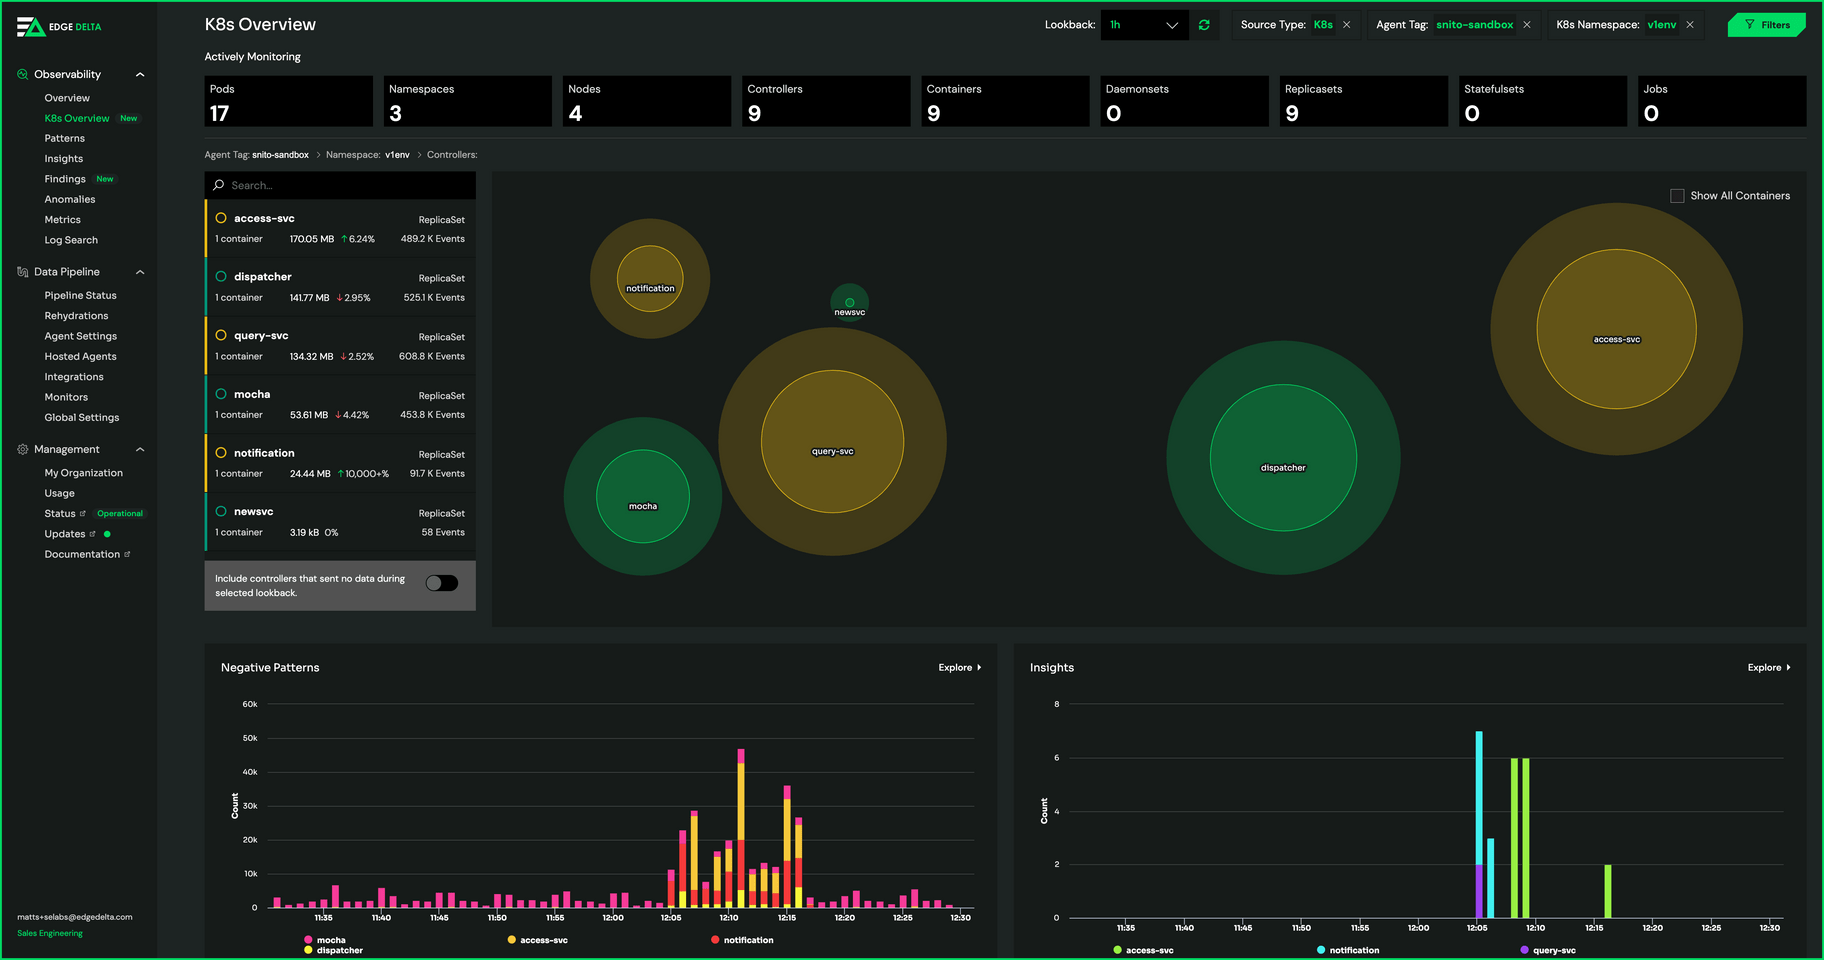
Here, we automatically map out your Kubernetes environment through our K8s Overview. In this view, each Kubernetes resource is associated with a circle, and the circle is sized based on the volume of the dataset it’s creating. So, your team can open the K8s Overview, quickly grasp which resources are generating the most data, and isolate that spike down to individual containers or controllers simply by clicking through the workflow. (From this view we also associate the patterns and insights detailed above to each resource.)
Correlating These Enhancements With Your Workflow
So, you’ve cut the volumes of logs you’re indexing by 80%+ and you’ve given your teams deeper context into each service behavior. Now, how do you map this to everything else you’re doing in Datadog (e.g., metrics, traces/APM)?
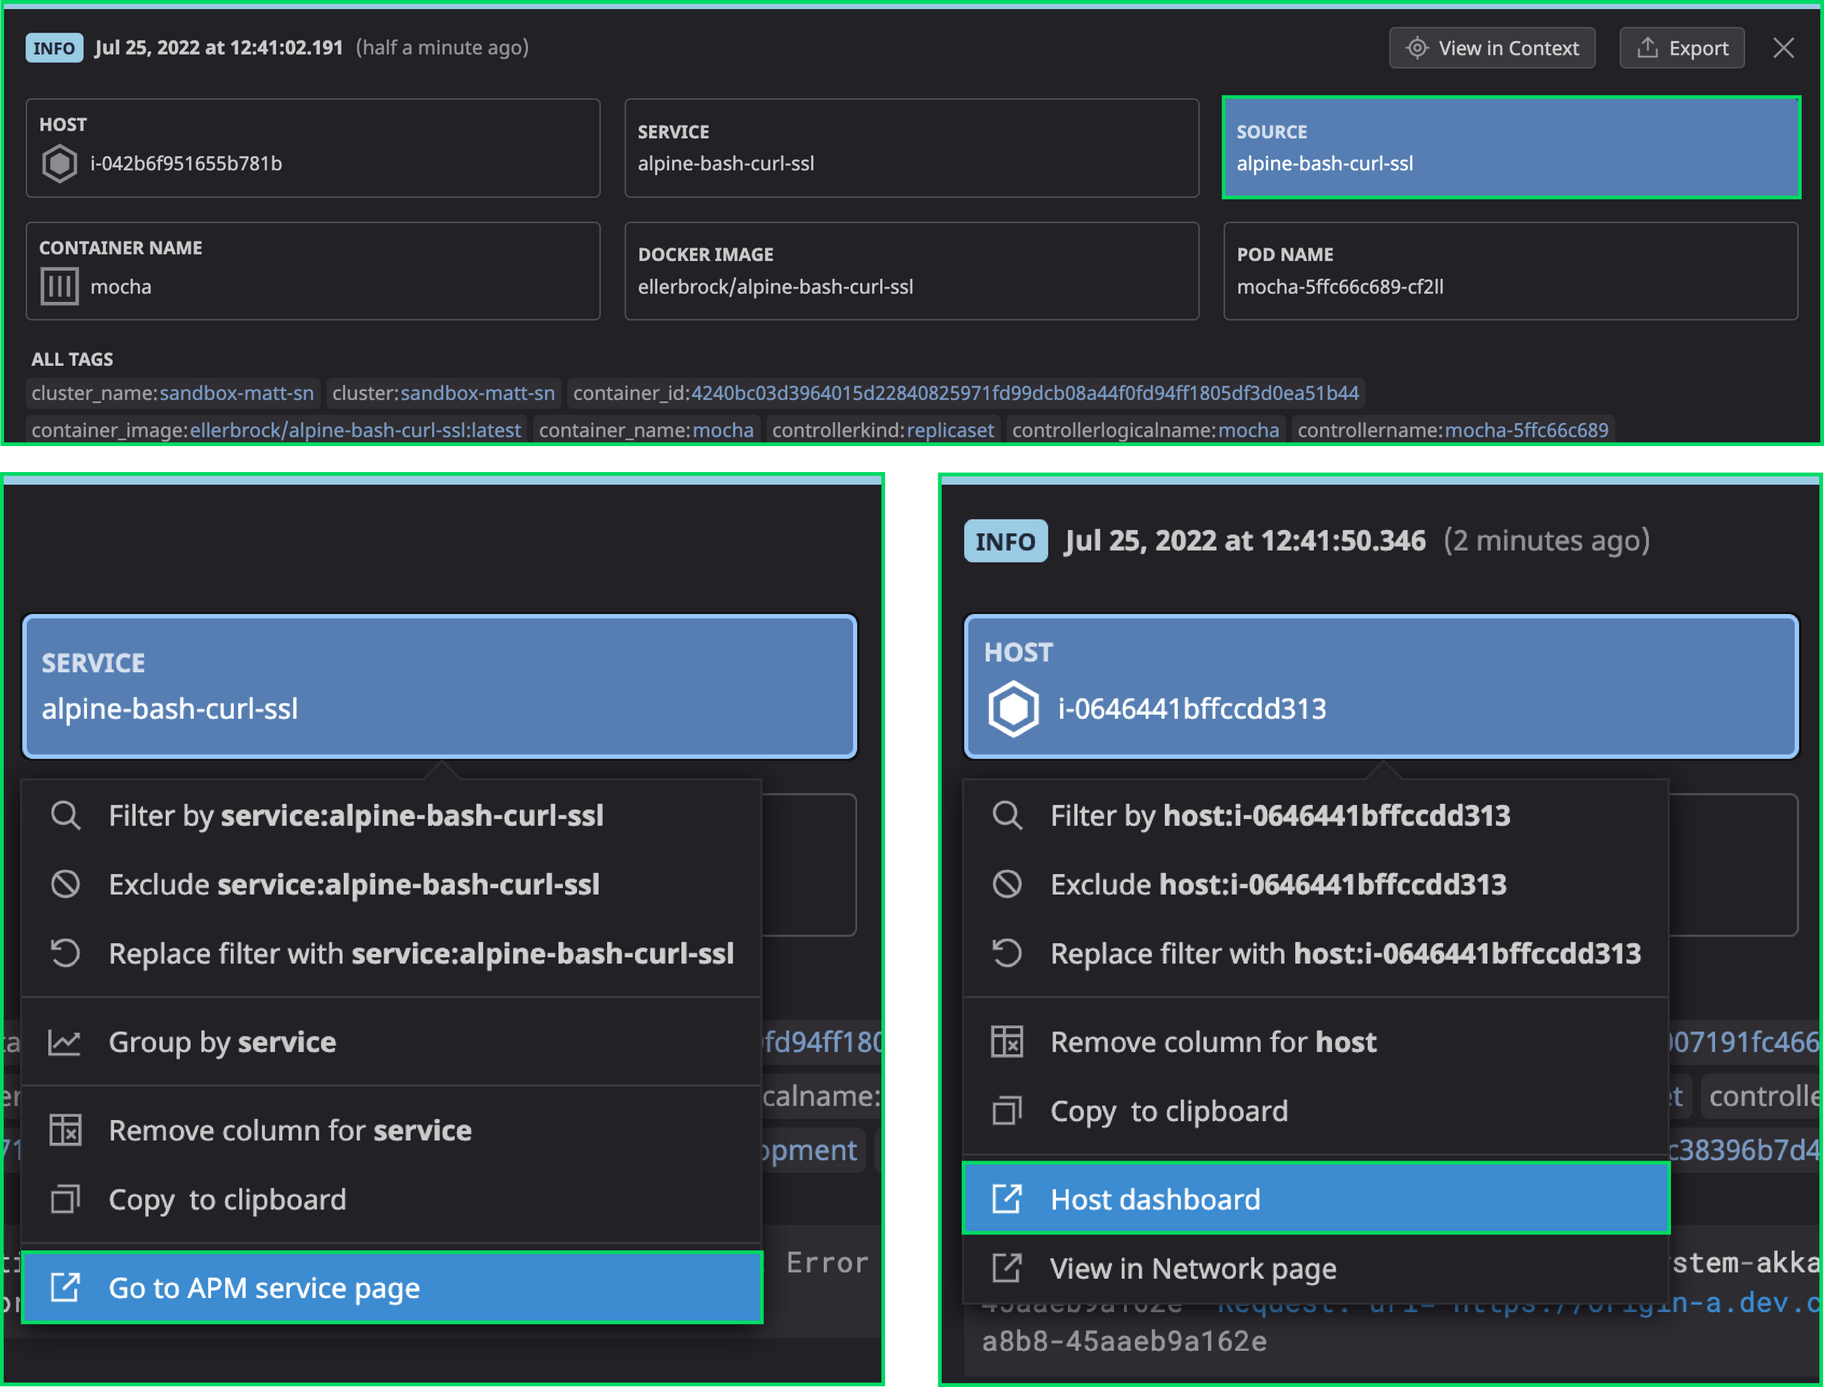
Datadog parsers are commonly built based on the source you are monitoring. Through the Unified Service Tags, customers can map their Datadog environment together, so they understand which logs correlate to which traces, which behaviors correlate to a given resource, and so on. Edge Delta agents can map to Datadog first-class objects for Host, Service, Container Name, Docker Image, and Pod Name giving users the ability to seamlessly pivot to other Datadog dashboards off of these entities.
Within the Edge Delta YAML Configuration File, you can also establish the source based on what you’re monitoring within Datadog. Taking this step ensures that everything you route through Edge Delta fits into your existing workflow, so your team can work the way they’re accustomed to (versus adding disparate datasets).
Edge Delta agents enrich the data going to Datadog with extracted attributes/labels from Kubernetes Helm charts in addition to any other outputs from AWS metadata, such as instanceid, cluster name or instance type.
Below is a sample enrichment filter YAML config.
inputs:
 kubernetes:
   - labels: web
     include:
       - "namespace=web"
     filters:
      - enrichment-dd
filters:
 - name: enrichment-dd
   type: enrichment
   dynamic:
     field_mappings:
           # - field_name: "service"
           #   value: '{{".labels.k8s-app"}}'
           - field_name: "instance_id"
             value: '{{".aws-instance.instance-id"}}'
           - field_name: "host"
             value: '{{".aws-instance.instance-id"}}'
           - field_name: "instance_type"
             value: '{{".aws-instance.instance-type"}}'
           - field_name: "source"
             value: '.annotations.ad.datadoghq.com/{{.container_name}}.logs'
             json_path: "[0].source"
             fallback_value: "{{.short_container_image}}"
           - field_name: "service"
             value: '.annotations.ad.datadoghq.com/{{.container_name}}.logs'
             json_path: "[0].service"
             fallback_value: "{{.short_container_image}}"
           - field_name: "cluster"
             value: '{{".aws-instance.cluster-name"}}'
           - field_name: "container_id"
             value: "{{.docker_id}}"
           - field_name: "image_name"
             value: "{{.container_image}}"
             transformers:
               - source: ":S+"
                 target: ""
                 type: "regex"
           - field_name: "image_tag"
             value: "{{.container_image}}"
             transformers:
               - source: "S+:"
                 target: ""
                 type: "regex"
Conclusion
To summarize, Edge Delta allows more advanced Datadog customers to reduce index volumes and gain intelligence into their service behavior through a few light customizations. Taking the approach detailed in this blog will allow you to reduce overages and identify/resolve anomalies more rapidly. And, you can do so while maintaining your existing workflows and processes.