

Many modern environments are generating petabytes of log data every day. As these environments grow more distributed and dynamic, the volume and velocity of logs continue to surge. That growth drives up storage, processing, and analysis costs — making effective log management both a technical and financial priority.
Yet logs remain indispensable. They power incident response, support regulatory compliance, surface performance issues, and provide the context security teams need to detect and investigate threats. It’s a familiar tension: logs are too valuable to discard, but too costly to manage inefficiently.
The pressure is only mounting. Between 2020 and 2022, enterprise cloud data volumes more than doubled. And with the global log management market projected to surpass $10 billion by 2034, the demand for scalable, intelligent observability is clear.
This guide outlines logging best practices that help you manage log data more efficiently, so you can improve performance, strengthen security, and stay ahead of compliance requirements.
Key Takeaways
• Treat log types differently. Separate operational, security, and audit logs to reduce noise and improve visibility.
• Standardize formats. Use structured logs (e.g., JSON or key-value) with consistent field names and severity levels.
• Design for scale. Implement tiered storage, scalable ingestion, and automated retention policies to manage data growth.
• Secure sensitive information. Mask credentials, encrypt log data, and enforce access controls and retention rules.
• Be intentional about logging. Don’t log everything — capture what’s useful and actionable.
Foundational Principles of Enterprise Logging
Enterprise logging is about extracting meaningful signals, not just capturing events. Enterprise logging isn’t about capturing every event — it’s about surfacing meaningful signals. Logging everything adds noise, drives up costs, and makes it harder to focus on what actually matters.
What works for smaller environments often breaks down at scale. In large, distributed systems, the volume of log data and the demands of compliance and cross-team collaboration introduce new layers of complexity. A strong enterprise logging strategy is critical — and it starts with a few foundational principles:
- Define the purpose of each log type
- Evaluate the value of the data
- Plan for long-term growth
- Align logging practices across teams
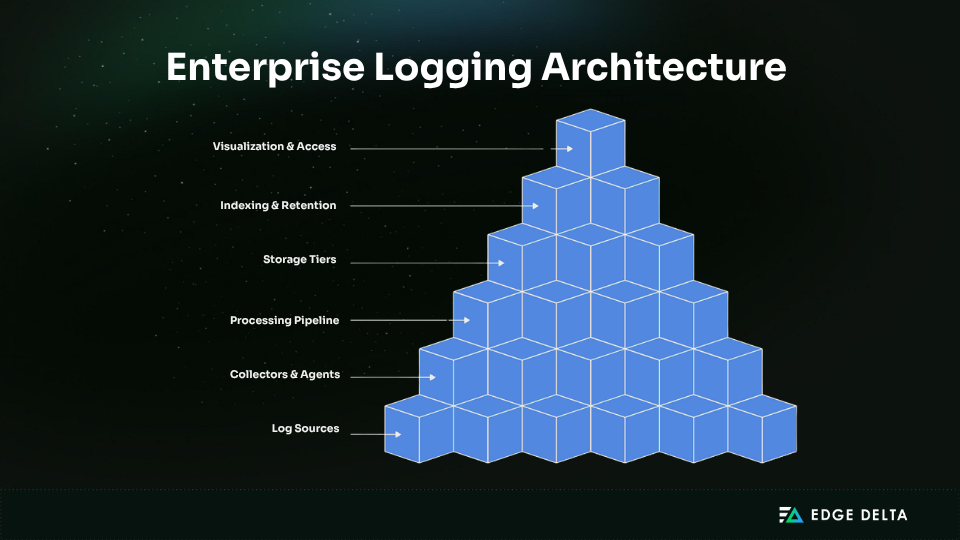
At the core of this strategy is a clear enterprise logging architecture: a structured flow that moves logs from source to storage through collectors and pipelines. This architecture ensures logs are ingested efficiently, retained appropriately, and made accessible for performance, security, and compliance use cases.
Understanding Operational, Security, and Audit Logs: Roles and Differences
Logs serve different purposes across the enterprise, and conflating them leads to inefficiency, risk, and cost overruns. At a high level:
- Operational logs help DevOps teams monitor application health, trace transactions, and resolve performance issues. These logs include service errors, latency metrics, and internal debug traces. They are often short-lived and stored in high-access “hot” storage for fast retrieval during incidents.
- Security logs track authentication events, access attempts, configuration changes, and network anomalies. They must be tamper-resistant and monitored in real time to detect threats and respond quickly.
- Audit logs provide an immutable trail of administrative actions, sensitive data access, and system-level changes. Audit logs are essential for compliance with regulations like HIPAA, PCI DSS, and SOX, and they require long-term retention and strict access controls.
Each log type has different stakeholders, retention policies, and tooling needs. Understanding the distinctions between system, security, and audit logs is crucial to avoiding pipeline bloat and ensuring relevant visibility.
Treating them uniformly leads to bloated pipelines and weak visibility where it matters most.
Designing Scalable Logging Systems for High-Performance Environments
Modern applications generate enormous volumes of log data — especially in containerized, cloud-native environments. Without a scalable architecture, teams can quickly run into performance bottlenecks, soaring costs, and slower incident response times.
To build for scale:
- Use structured logging (e.g., JSON or key-value pairs) to enable machine parsing, log correlation, and rapid filtering.
- Apply correlation IDs across services to trace user actions and request flows in distributed systems.
- Adopt horizontally scalable log collectors and storage systems, such as Fluent Bit, Loki, or OpenSearch.
- Separate hot and cold storage by keeping recent logs in fast-access systems (e.g., Elasticsearch or indexed object databases) while archiving less critical logs to low-cost backends like Amazon S3 or Google Cloud Storage.
- Leverage a telemetry pipeline solution like Edge Delta for cost-effective log routing and intelligent optimization — processing data at the edge to reduce ingestion volume, improve query performance, and control storage costs.
Scalability is not just about ingestion — it’s about the entire data lifecycle. Architectures optimized for telemetry efficiency at the edge can dramatically lower costs while still delivering real-time insight. A well-designed system should handle sudden data bursts, automate log expiration, and minimize downstream query latency.
Balancing Logging Depth and Cost: A Practical Framework
More logging doesn’t always equal better visibility. Excess data can create noise, slow investigations, and drive up storage costs. Enterprises need a strategy that captures the right data — not just more of it.
Start by classifying logs by value:
- Critical logs (e.g., authentication failures, financial transactions) should be retained and indexed long term.
- Verbose/debug logs can be sampled, rotated aggressively, or disabled in production.
- Use log levels consistently across teams to control verbosity and enforce retention policies based on data importance and compliance needs.
For high-frequency events, apply sampling or dynamic filtering to reduce volume while preserving essential insight. Solutions like Edge Delta can provide intelligent recommendations on what to filter or sample, helping teams optimize signal-to-noise ratio without losing critical observability.
Use log levels consistently across teams to control verbosity. Implement retention policies based on data importance and compliance needs.
When it comes to storage, design retention and tiering strategies with total infrastructure costs in mind — ingestion, storage, and query latency. Intelligent telemetry pipelines like Edge Delta can automate data tiering, keeping recent logs in fast, searchable storage while routing older or lower-value logs to cost-efficient archives.
The goal is to maximize insight while controlling volumes and costs. Smart logging keeps systems observable, performant, and cost-controlled — empowering teams to manage high log volumes efficiently.
Structured Logging** and Standardization **
As modern systems scale, log volumes grow rapidly. To maintain control and gain meaningful insights, logs must be both machine-readable and human-friendly. Structured logging provides a consistent way to format log data using key-value pairs or JSON objects, enabling faster querying, automated analysis, and cross-platform observability.
Unstructured logs, like free-form text lines, may be readable by humans but are difficult to parse at scale. Structured logs, on the other hand, support automation, correlation, and real-time monitoring, making them foundational to modern log management.
JSON vs Key-Value vs Plain Text Formats
Unstructured logs (like plain text) are readable by humans but difficult to parse at scale. They often require custom parsers or regex and are prone to format drift.
Structured logs, especially in JSON or key-value formats, are machine-readable and easier to analyze. JSON is the most flexible and widely supported, while key-value pairs offer a lighter-weight alternative in performance-sensitive environments.
Example – JSON:
{
  "timestamp": "2025-07-16T10:42:01Z",
  "level": "error",
  "event": "order_fetch_failed",
  "user_id": 3942
}
Example – Key-Value:
timestamp=2025-07-16T10:42:01Z level=error user_id=3942 event=order_fetch_failedAdopting structured logging improves automation, cross-system correlation, and real-time monitoring.
Cross-Platform Standardization Strategies
Enterprises operate in heterogeneous environments, including microservices, databases, container platforms, and legacy applications, which often produce logs in different formats. Without a common structure, analyzing logs across systems becomes fragmented and inefficient.
To solve this challenge, organizations should adopt standardization practices that ensure consistency across all log sources. These practices include:
- Consistent formats (e.g., JSON or key-value)
- Unified timestamp styles (preferably ISO 8601 with time zone support)
- Standard severity levels (e.g., debug, info, warn, error, fatal)
- Shared field naming conventions (e.g.,
user_id,request_id,service_name)
Using logging libraries that support structured output, such as Slog for Go, Serilog for .NET, Pino for Node.js, or Log4j for Java, helps ensure consistency across services.
Teams can also align on a schema using public standards like OpenTelemetry Semantic Conventions, which define common attributes for logs, metrics, and traces.
This kind of standardization improves collaboration, enables automation, and ensures logs can be correlated effectively across a distributed system.
Legacy System Integration Approaches
Many legacy systems produce unstructured logs that don’t support structured logging out of the box. Instead of rewriting those systems, organizations can use ingestion tools to transform logs on the fly.
Tools like Edge Delta can parse, transform, and normalize these logs at ingestion using processors such as Grok parsing, JSON extraction, and schema mapping. Logs can be enriched with additional context (e.g., GeoIP data) and routed to multiple destinations, such as SIEM platforms, observability tools, or archival storage.
For long-term transitions, teams can implement dual logging, using structured output for new components while retaining legacy formats where needed. Middleware can also normalize field names (e.g., mapping user and user_id to a common schema) to support consistent querying.
Log Levels and Event Classification
Effective log management starts with using the right log level for the right event. Assigning appropriate verbosity ensures teams get the visibility they need without overwhelming storage systems or missing critical signals.
Logging frameworks typically support six standard levels: FATAL, ERROR, WARN, INFO, DEBUG, and TRACE. Each is designed for a specific severity and audience:
| Level | Purpose | Enterprise Use Case |
|---|---|---|
| FATAL | Critical failure halts application execution | Crash loop in a core service, app shutdown due to configuration corruption |
| ERROR | Recoverable failure disrupting functionality | Payment gateway timeout, database write failure |
| WARN | Unexpected behavior that may escalate | API rate limit warning, deprecated feature usage |
| INFO | High-level system operations | User login events, job completions, and health check success |
| DEBUG | Developer-centric diagnostic info | Cache miss reasons, internal service call responses |
| TRACE | Step-by-step code execution flow | Detailed tracing of algorithm decisions or service orchestration flows (e.g., tracing ID) |
In production, log levels are usually set to INFO or WARN to reduce overhead while maintaining observability. DEBUG and TRACE are typically disabled unless troubleshooting is required.
For dynamic environments, logging levels should be adjustable at runtime. This allows teams to increase verbosity during incidents without restarting services. Best practices include scoping changes narrowly, reverting after a timeout, and auditing level changes for traceability.
Clear classification (by severity, purpose, and audience) ensures the right logs reach the right people, supports retention and access control, and keeps operational noise in check.
Sampling Strategies for High-Volume Applications
In high-throughput systems, logging every event isn’t sustainable. Log sampling reduces volume while preserving important signals.
Common strategies include:
- Random Sampling: Logs a fixed percentage of events.
- Time-Based Sampling: Captures a limited number of logs per second or minute.
- Hash-Based Sampling: Uses consistent fields (like
user_id) to retain full logs for specific users or sessions. - Adaptive Sampling: Adjusts sampling rates based on system load or error rates.
Applying sampling at the application or ingestion level helps control costs without losing visibility. Pairing it with event classification ensures critical logs reach the right teams.
Centralized Logging** Architecture **
As systems grow more distributed, log data comes from many sources: containers, VMs, APIs, databases, and cloud services.
A centralized logging architecture brings this data together in one place, making it easier to search, analyze, and correlate events across the stack. This is a key benefit of effective log aggregation across diverse systems.
Without a unified approach, troubleshooting becomes fragmented and slow. Below is a breakdown of core patterns and strategies for building scalable, reliable centralized logging in enterprise environments.
Collection Patterns and Architecture Choices
The way logs are collected depends on your environment and operational needs. Most enterprise setups use a combination of approaches:
- Sidecar Containers run alongside application containers in Kubernetes, isolating logging from application code while simplifying log routing.
- Direct Shipping allows apps to send logs straight to a destination via SDKs or HTTP. It’s simple but can be brittle without buffering or retry support.
- Syslog is still used in legacy systems and network devices, though it lacks structure and flexibility.
- Cloud-Native Sources like CloudTrail and VPC Flow Logs feed logs into platforms like S3 or CloudWatch, then into your logging pipeline.
- Telemetry Pipelines like Edge Delta provide centralized, configurable processing and routing of logs and metrics — enabling transformation, enrichment, and intelligent data flow management across distributed environments.
Choosing the right mix ensures coverage across modern and legacy systems without unnecessary complexity.
Reliability and Failure Handling
Even the best architecture needs to handle failure gracefully. Logging pipelines must account for spikes, outages, and delivery errors. Otherwise, logs get lost when they’re needed most.
Buffering (in memory or on disk) helps absorb bursts or destination downtime. Retry logic with backoff reduces the risk of dropped logs. When possible, configure failover targets, like fallback buckets or local storage, to ensure continuity.
While most systems offer “at-least-once” delivery, truly “exactly-once” delivery often requires downstream deduplication logic.
Integration with Modern Observability Stacks
Centralized logging is most powerful when combined with metrics and traces. Tools like OpenTelemetry provide a common framework for collecting telemetry data across systems.
Some platforms, such as Edge Delta, support open standards out-of-the-box — and process logs at the edge to reduce storage costs and enable real-time alerting. Correlating logs with performance metrics and traces gives teams deeper insight, faster diagnostics, and better visibility across distributed services.
Security and Compliance in Logging
Logs often contain sensitive information, making secure handling essential. To reduce risk, avoid logging secrets such as passwords or tokens. Use masking or redaction to protect sensitive fields, and encrypt logs both in transit and at rest. Solutions like Edge Delta offer built-in masking capabilities to automatically obscure sensitive data before it reaches its destination.
Access controls should adhere to the principle of least privilege. Implement role-based access control (RBAC) and store logs in immutable, tamper-evident systems. Maintain audit trails that record who accessed logs and when.
Regulations like HIPAA, PCI-DSS, SOX, and GDPR impose requirements for retention periods, access controls, and data integrity. Compliance often requires long-term storage, timestamping, and real-time alerting.
During incidents, logs are critical for forensic analysis. Real-time streaming to SIEM tools, standardized formats, and enriched metadata enable security teams to trace threats quickly and accurately.
Log Retention and Lifecycle Management
As log volumes grow, teams need to manage retention carefully to balance cost, performance, and compliance. Logs must be accessible when needed, but not stored indefinitely at high cost.
Tiered Storage Strategies
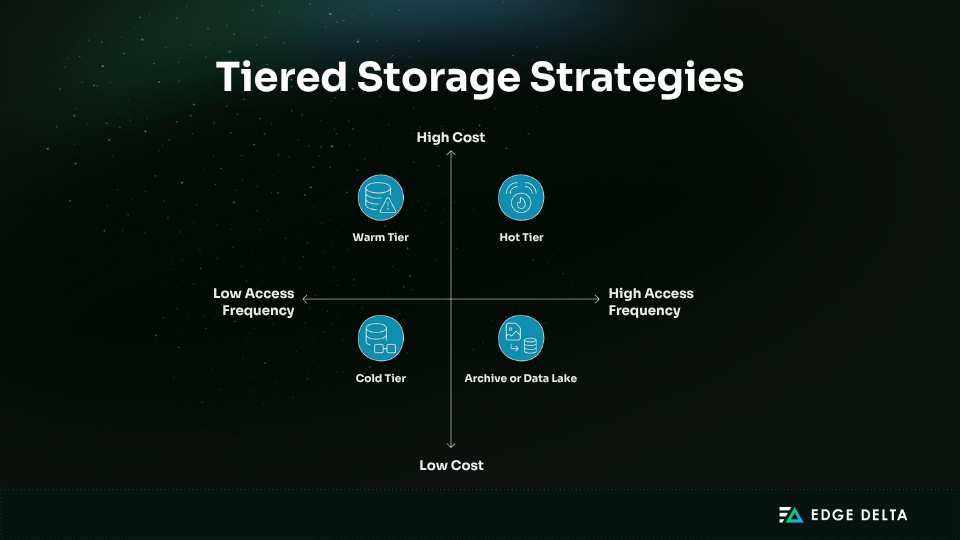
Not all logs need the same level of access. Tiered storage helps match log data to the right storage type based on how often it’s used and how long it’s kept.
- Hot Tier: Stores recent logs used for monitoring and troubleshooting. Fast access, high cost. Typical retention: 30–90 days.
- Warm Tier: For less frequent access, like audits or incident reviews. Slower, more affordable. Retention: 3–12 months.
- Cold Tier: Used for long-term storage (1–7 years) for compliance or investigations. Low cost, higher latency.
- Archive or Data Lake: For infrequently accessed logs. High compression and very low cost, but slow retrieval.
Edge Delta supports tiered storage by routing data from any source to any destination, including legacy observability platforms, SIEMs, and cost-effective object storage solutions like Amazon S3. This flexible routing helps organizations optimize storage costs while maintaining accessibility and compliance.
Automated Lifecycle Policies
Automating log retention ensures consistency and reduces manual effort. Policies typically define how logs move between storage tiers and when they are deleted.
Common examples include:
- Index rotation: Rolls over logs after a set size, time, or document count.
- Lifecycle rules: Automatically move logs based on age or activity.
- Retention enforcement: Deletes logs once they expire, unless flagged for legal hold.
A typical policy might keep security logs in hot storage for 90 days, move them to cold storage for six years, then delete them automatically unless required for legal or compliance reasons.
Legal Hold and Compliance Considerations
Regulatory requirements often dictate how long logs must be retained. Some common standards include:
- HIPAA: 6 years for audit logs documenting access to protected health information (PHI).
- SOX: 7 years for financial records and audit trails.
- PCI DSS: 1 year for access and security event logs, with 3 months immediately accessible.
- GDPR: Requires data minimization and deletion on request, though this can conflict with longer-term retention obligations.
In addition to standard retention, organizations must support legal holds — temporary suspensions of log deletion triggered by litigation or investigations. These overrides must be tracked, documented, and enforced.
Lifecycle systems should allow teams to pause deletions, audit exceptions, and monitor access. Logs under legal scrutiny must be stored securely with metadata showing retention status, hold activity, and access history. Secure deletion and audit-ready tracking are essential for compliance.
Log Analysis and Monitoring
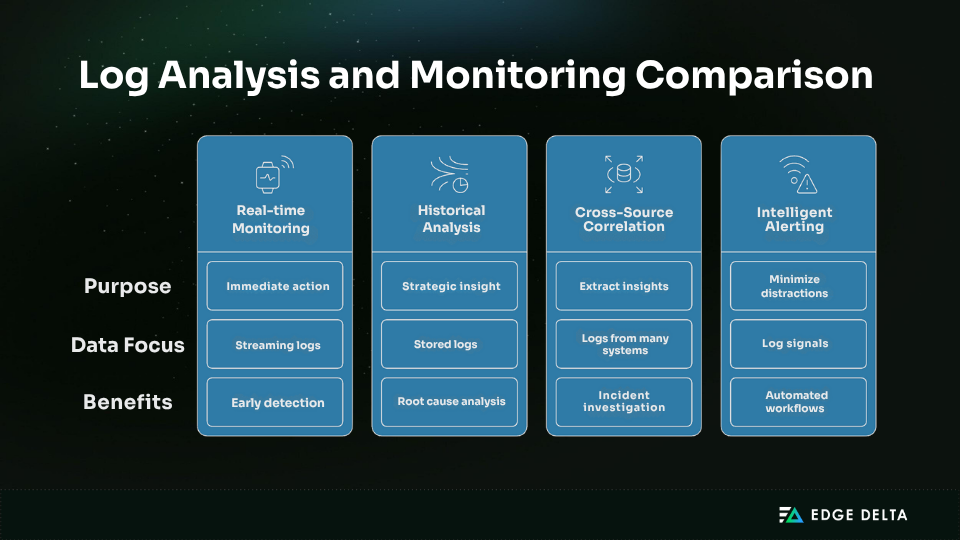
In cloud-native systems, logs are no longer just static records. They’re live data streams that drive detection, alerting, and root cause analysis. Analyzing logs in real time and over time helps teams respond quickly and uncover long-term trends.
Real-time Monitoring vs. Historical Analysis
Real-time monitoring enables teams to detect and respond to issues as they occur. Streaming logs directly from applications or infrastructure surfaces anomalies such as traffic spikes or failed deployments. This early visibility is crucial during incident response.
- Real-time logs can also trigger automated actions — like isolating services or alerting teams — helping to reduce downtime.
- Historical analysis serves a different but complementary purpose. By querying logs over time, teams can identify trends, investigate incidents, and support audits. It is essential for root cause analysis, compliance reporting, and long-term reliability improvements.
Both types of analysis are important: real-time monitoring drives rapid response, while historical data provides strategic insights. Each requires purpose-built systems — low-latency pipelines for real-time needs and scalable indexing for long-term access.
Cross-Source Correlation Techniques
To investigate issues across distributed systems, teams need to correlate logs from different sources using shared identifiers.
Common methods include:
- Correlation or trace IDs to link events across services
- Timestamps to reconstruct sequences of events
- Structured fields like user ID, pod name, or region for grouping
Tools like Edge Delta can automatically apply metadata to log streams to filter and connect log entries quickly. Correlation helps teams spot root causes, trace cascading failures, and build a complete incident timeline.
Intelligent Alerting Strategies
Too many alerts lead to noise and missed signals. Effective alerting focuses on relevance and clarity. Smart strategies include:
- Anomaly detection to flag unexpected patterns
- Severity filters to route alerts to the right teams
- Correlation-aware alerts that combine related log signals
- Context-rich notifications with links to dashboards or logs
Good alerts inform rather than prescribe. They highlight where attention is needed and give teams the context to act. When well-tuned, alerts accelerate response and integrate with automated workflows like runbooks or incident tracking.
Implementation Roadmap and Best Practices
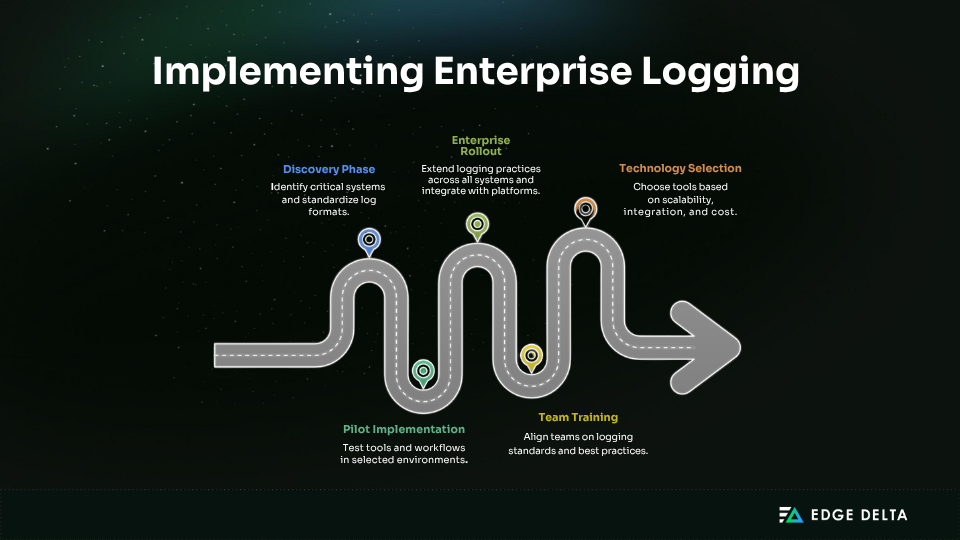
Implementing enterprise logging at scale requires a phased, step-by-step approach. A strong strategy balances technical rollout, team readiness, and ongoing maintenance, especially in complex environments with legacy systems and multiple stakeholders.
Grounded in log management best practices, this roadmap supports standardization, training, and tool alignment to drive long-term observability and resilience.
Phased Implementation Strategy
Start by identifying systems that produce critical logs, such as authentication services, financial workflows, and infrastructure. Standardize formats and retention rules for these data streams first.
Then, pilot centralized logging in select environments. Validate tooling, integrations, and workflows before expanding to other teams. Use early wins to build momentum and refine policies.
In the final phase, roll out logging across all environments, development pipelines, and compliance systems. Integrate with monitoring and incident platforms. This staged rollout reduces risk and helps drive alignment across teams.
Team Training and Change Management
Success depends on shared standards and consistent practices. Train teams on log levels, formats, and use cases. Emphasize that each team owns the quality of its logs. Documentation and strong leadership help maintain alignment as systems grow.
Technology Selection and Vendor Evaluation
Choose tools based on architecture, scale, and team expertise. Evaluate for scalability, structured logging support, and ease of use. Involve users in pilots to test real-world fit.
Consider both commercial and open-source tools. Consider tools like Edge Delta, which help teams ensure compliance, avoid vendor lock-in, and control costs at scale.
Common Pitfalls and How to Avoid Them
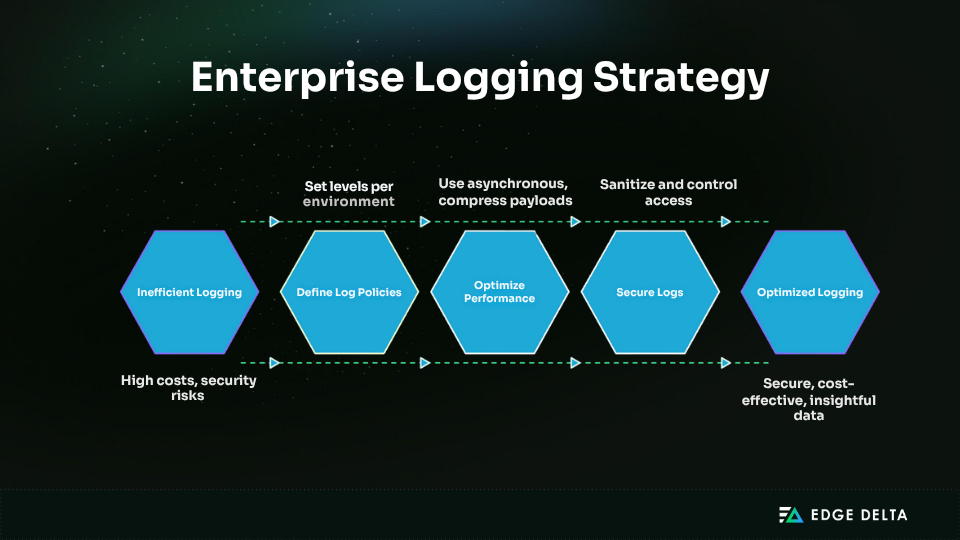
Many enterprises struggle with logging because of poor strategy and execution. Logging is not just about collecting data. It must be planned, optimized, and aligned with business goals. Without a clear framework, teams face high costs, low signal-to-noise ratio, and security risks.
Over-Logging and Under-Logging
Excessive logging creates noise and increases storage costs, while insufficient logging can result in missing critical context during incidents. DEBUG and TRACE logs should generally be disabled in production environments unless actively troubleshooting.
Recommended Fix*: Define log level policies by environment and audit noisy services regularly.*
Performance Impact and Cost Spirals
Synchronous or verbose logging can slow applications and strain resources, especially under high load. Large, uncompressed log payloads increase CPU, memory, and storage use.
Best Practice:** Use asynchronous logging, compress output, and limit log size. Apply tiered retention and monitor log volume to prevent unexpected cost spikes.
Security Vulnerabilities in Logs
Logs can expose sensitive data like credentials or personal information if not properly filtered. They’re also common targets during attacks.
***Security Tip: ***Sanitize logs at the source, mask secrets, and enforce strict access controls. Store logs in tamper-proof systems and audit them regularly to meet compliance and reduce risk.
Conclusion
Logging is more than just an operational task — it’s the foundation for performance, security, and compliance. When done well, it accelerates incident response, reduces downtime, and enables smarter decision-making.
Early-stage teams should prioritize standardizing log formats, centralizing log collection, and defining clear retention policies. Mature teams can further enhance their systems by refining pipelines, implementing alerting, and integrating with observability and SIEM platforms.
Logging should evolve alongside your infrastructure. Whether troubleshooting or auditing, well-managed logs provide the context teams need to act confidently and quickly — turning raw data into a strategic operational advantage.
FAQs
What are the most critical logs to collect for security and compliance?
Prioritize system logs, authentication logs, access logs, network traffic, API activity, and audit trails. These logs support threat detection, incident response, and compliance frameworks like PCI-DSS, HIPAA, and ISO 27001.
How should we handle logging in microservices and cloud-native environments?
Use a centralized log aggregator that supports distributed tracing and structured logging. Implement correlation IDs to track requests across services. Open standards like OpenTelemetry help teams standardize logging across Kubernetes and serverless environments, while telemetry pipeline solutions like Edge Delta enable real-time data processing, intelligent filtering, and efficient routing — reducing noise and optimizing costs without sacrificing visibility.
How long should we retain different types of logs?
Log retention depends on compliance and business needs. Security and audit logs are typically kept for one to seven years, while application logs are retained for 30 to 90 days. Debug logs usually only need to be stored for one to seven days. To balance cost and compliance, consider using solutions like Edge Delta to implement tiered storage or log rehydration so that older logs can be archived and retrieved only when needed.
References

