


Modern IT systems generate massive amounts of log data — recording everything from user activity, login attempts, and system performance metrics to security events. As businesses scale with cloud services, microservices, and connected devices, maintaining visibility across distributed systems becomes increasingly challenging.
Log collection describes the process of systematically gathering log data from multiple sources (servers, applications, firewalls, and cloud platforms), allowing users to centralize and process it for analysis and storage. Without strategic log collection, teams miss critical signs of system failures or security threats, leaving organizations blind to operational issues.
Furthermore, data explosion is driving this need. Global data creation will reach 181 zettabytes in 2025 and a staggering 394 zettabytes by 2028, with much growth fueled by Internet of Things (IoT) devices like smartwatches and industrial sensors. Organizations without clear log collection strategies face tool sprawl, inconsistent data formats, and overwhelmed systems.
Key Takeaways:
• Log collection provides centralized visibility across systems to support monitoring, troubleshooting, and security.
• Multi-source logging reveals different layers of system behavior, performance, and potential threats.
• Collection methods like agent-based, agentless, hybrid, push, and pull should match system complexity and operational needs.
• Architecture choices, whether centralized, distributed, or edge based, can affect how well log systems scale and handle diverse environments.
• Efficient logging requires balancing performance impact, data volume, and information security.
• Tool selection should align with your infrastructure, expertise, and scalability requirements.
Understanding Log Collection
Log collection serves as the foundation for comprehensive system visibility, enabling teams to monitor performance, detect issues, and ensure security through structured data management.
Defining Log Collection
Log collection systematically gathers log data from across an organization’s IT environment (servers, applications, network devices, security tools, and cloud infrastructure) then organizes it for analysis and storage. A log records system events, transactions, user activities, performance metrics, or errors generated continuously by operating systems, databases, firewalls, web servers, and other infrastructure components.
Common log examples include:
- System logs tracking operating system events like reboots, service starts, or failed login attempts.
- Application logs recording transactions, errors, and service-specific activities from custom or third-party software.
- Security logs from firewalls or intrusion detection systems flagging suspicious access attempts or policy violations.
Collected logs arrive in varied formats: syslog, JSON, Windows Event Logs, or custom application formats. Modern observability platforms unify these diverse sources into consistent, searchable formats for streamlined analysis.
Log collection forms the foundation of comprehensive log management, preceding log aggregation (combining logs across sources) and log analysis (searching, parsing, and interpreting data to uncover insights or detect anomalies).
Why Log Collection Matters
Organizations rely on strategic log collection for four critical business functions:
-
Troubleshooting and Diagnostics: When applications fail or services degrade, logs reveal the sequence of events leading to issues, helping teams identify root causes quickly and reduce mean time to resolution.
-
Performance Monitoring: Logs provide essential visibility into system behavior and bottlenecks. Repeated 500-level HTTP errors in web server logs may indicate backend database failures or capacity constraints.
-
Security Detection: Centralized log aggregation enables security teams to detect anomalies like brute-force attacks, unauthorized access attempts, or data exfiltration in near real-time across entire infrastructure
.
-
Compliance and Audits: Logs serve as verifiable audit trails essential for regulatory standards like GDPR, HIPAA, SOC 2, and PCI-DSS, providing legally defensible records of system access and data handling.
Manual log collection is labor-intensive and prone to gaps or inconsistencies. Automated log collection enabled by tools like Fluent Bit, Logstash, Edge Delta, or native cloud agents scales efficiently and ensures reliable, consistent coverage across dynamic cloud-native environments.
Common Log Sources
![]()
Comprehensive infrastructure visibility requires collecting logs from diverse sources throughout the technology stack. Each log source contributes distinct insights into system performance, user behavior, and security posture.
Application Logs
Generated by custom or third-party software, these logs track user activity, errors, transactions, and business logic execution. Examples include Apache or NGINX access logs showing web traffic patterns, SQL query logs from databases like MySQL or Postgres revealing performance bottlenecks, and error logs from web applications or APIs indicating code issues or integration failures.
System Logs
Produced by operating systems like Windows, Linux, or macOS, these logs capture low-level infrastructure events such as service restarts, kernel panics, failed processes, hardware failures, and resource exhaustion. Windows Event Logs and Linux syslog files represent the most common system log formats in enterprise environments.
Security Logs
These logs record events related to authentication, authorization, and threat detection activities. They include login attempts, permission changes, privilege escalations, and alerts from antivirus tools or intrusion detection systems (IDS/IPS). Logs from security tools like OSSEC, CrowdStrike, or next-generation firewalls provide crucial data for threat hunting and incident response.
Network Logs
Network infrastructure devices like routers, switches, load balancers, and firewalls generate logs showing traffic patterns, configuration changes, access control decisions, and performance metrics. DNS query logs and VPN activity logs also help track communications between internal systems and external networks, providing visibility into potential data exfiltration or command-and-control communications.
Cloud Service Logs
Cloud platforms provide native logging capabilities for comprehensive activity monitoring. Examples include AWS CloudTrail for API activity tracking, Azure Activity Logs for user and service actions, Google Cloud’s Audit Logs for governance and security oversight, and container orchestration logs from Kubernetes clusters showing pod lifecycle events and resource utilization.
Collecting data from all these sources and implementing intelligent observability pipelines helps teams build a complete picture of their infrastructure’s health, security posture, and operational performance.
Different Types of Log Collection Methods
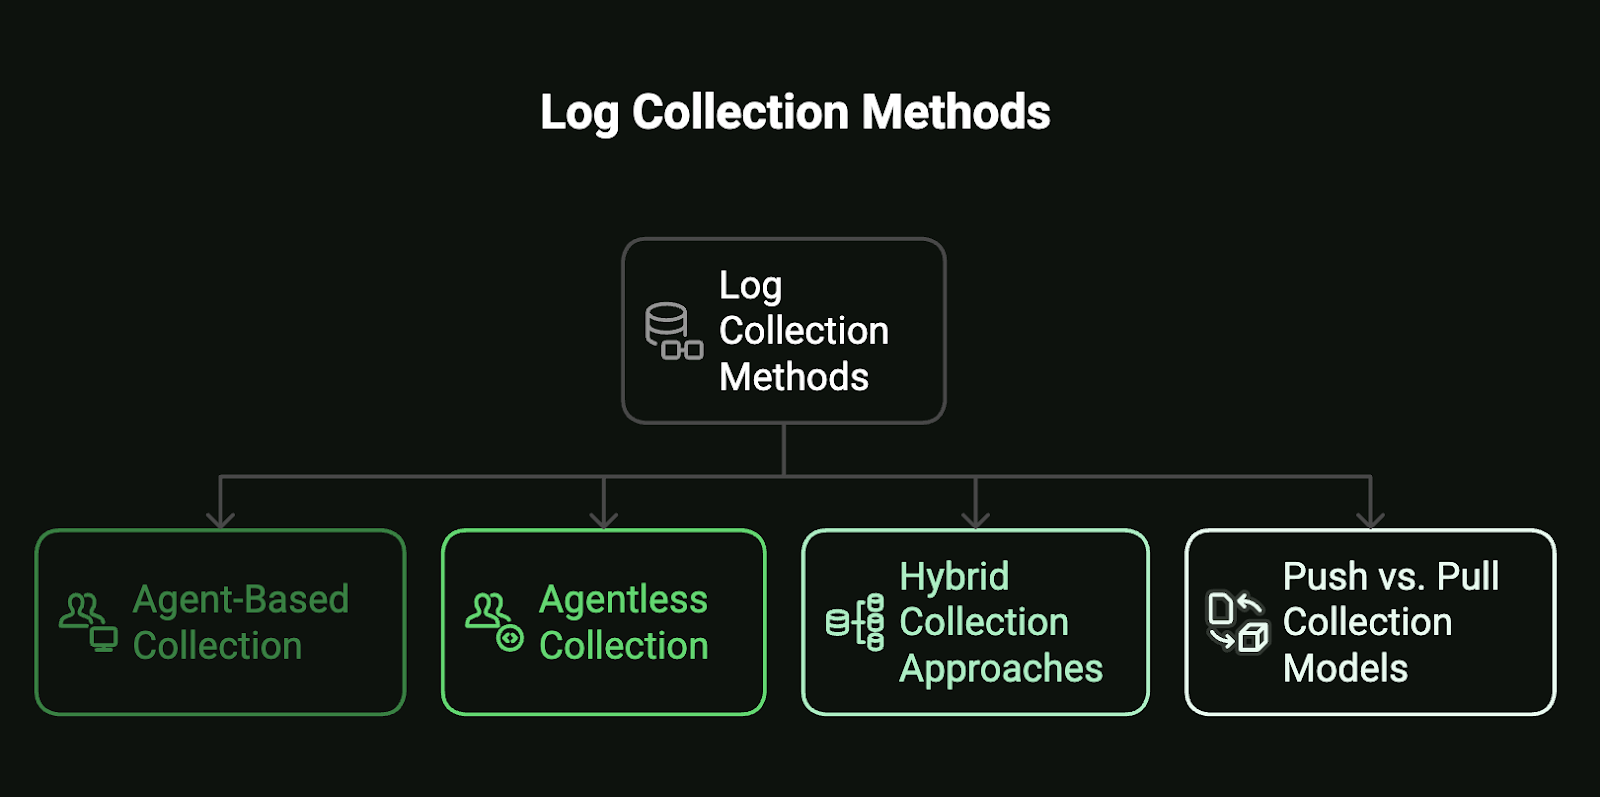
Understanding various log collection approaches is critical for designing a scalable, reliable, and secure logging infrastructure. Each method offers distinct trade-offs in complexity, performance, resource utilization, and environmental suitability.
Agent-Based Collection
Agent-based log collection involves installing lightweight software agents directly on systems that generate logs. These agents collect, process, and forward log data to centralized platforms or log aggregators with advanced processing capabilities.
How it works: Agents like Fluentd, Edge Delta, Filebeat, and Logstash Forwarder run as services on host machines, monitoring log files (e.g.,/var/log/), system events, or application outputs. They apply parsing rules, data enrichment, and filtering before forwarding processed data over secure protocols such as HTTPS, TCP with TLS, or via message queues like Kafka.
Popular agents:
- Fluentd: Open-source data collector that unifies log data collection and consumption with extensive plugin ecosystem
- Filebeat: Lightweight log shipper from Elastic Stack designed for efficient forwarding and centralization
- Logstash agents: Commonly used in ELK Stack deployments for complex data ingestion and transformations
- Edge Delta agents: Efficient Go-based agents designed for enterprise-grade processing.
Advantages:
- Real-time collection and transmission with minimal latency
- Local buffering and intelligent retry logic improve data reliability
- Supports preprocessing, filtering, and enrichment at the source, reducing downstream processing load
- Enhanced security through encrypted transmission and local data validation
Disadvantages:
- Adds resource overhead to host systems (CPU, memory, disk I/O)
- Requires agent deployment, configuration management, updates, and health monitoring
- Potential security vulnerabilities if agents are misconfigured or compromised
- Increased operational complexity for large-scale deployments
Best use cases: Agent-based collection excels in environments requiring deep observability, such as microservices architectures, Kubernetes clusters, and security-sensitive systems where preprocessing reliability and local intelligence are critical for operational success.
Example: In Kubernetes environments, Edge Delta is commonly deployed as a DaemonSet to collect container logs from all nodes and route them to centralized logging backends like Elasticsearch, Grafana Loki, or cloud-native platforms.
Agentless Collection
Agentless log collection retrieves logs through existing protocols, APIs, or shared network locations without installing additional software on target systems.
There are 3 primary agentless methods that enable log collection:
- Syslog-based collection: Systems send logs directly to central syslog servers (e.g., rsyslog, syslog-ng) using standard network protocols.
- API-based collection: Cloud services like AWS CloudTrail, Azure Monitor, and Google Cloud Logging expose logs via REST APIs that collectors can poll or stream continuously.
- Network-based techniques: Protocols like Windows Event Forwarding (WEF), SNMP traps, or WMI enable remote log retrieval from endpoints without local agents.
Advantages:
- No need to install, configure, or maintain agents on individual endpoints
- Lower performance impact on monitored systems
- Simplified deployment across heterogeneous environments with diverse operating systems
- Reduced security attack surface from fewer installed components
Disadvantages:
- Limited control over log format, structure, or preprocessing capabilities
- Higher risk of data loss during network transmission without local buffering
- No intelligent retry mechanisms or local data validation
- Potential network bandwidth consumption from unfiltered log transmission
Agentless collection suits standardized systems with uniform log formats, read-only network appliances (routers, switches, firewalls), legacy systems where agent installation isn’t feasible, or large-scale environments where agent maintenance overhead outweighs benefits.
Example: In hybrid cloud environments, modern observability platforms offer integrations that pull logs from services like Amazon S3, Microsoft 365, or firewall appliances using API connectors, webhook receivers, or centralized syslog endpoints.
Hybrid Collection Approaches
Hybrid log collection strategies combine agent-based and agentless methods to optimize coverage, performance, and operational overhead across diverse infrastructure environments.
Organizations deploy agents on critical systems requiring advanced processing, real-time analysis, or reliable transmission guarantees. Simultaneously, less critical systems, network appliances, or external services are monitored using agentless techniques like API polling, webhook receivers, or centralized syslog ingestion.
Advantages:
- Flexibility to adapt collection methods to different system requirements and constraints
- Optimized resource utilization by avoiding unnecessary agent overhead
- Centralized visibility across cloud, on-premises, and edge systems with unified data formats
- Risk mitigation through diversified collection approaches
Disadvantages:
- Increased architectural complexity requires careful pipeline design and monitoring
- Higher coordination requirements between different teams and collection methods
- Potential data format inconsistencies requiring additional normalization efforts
Example of hybrid architecture: A financial services company might deploy Filebeat agents on high-throughput trading servers for real-time log ingestion and processing, while simultaneously using AWS CloudWatch API integrations to collect logs from cloud-hosted services. Both data streams feed into a centralized SIEM platform for unified security monitoring and compliance reporting.
Push vs. Pull Collection Models
Log collection approaches can also be classified by data flow direction and initiation responsibility.
- Push Model: In push models, log sources actively send data to central collectors or log aggregation services. This represents the default behavior in most agent-based tools where Filebeat pushes logs to Logstash, or applications send logs directly to centralized endpoints.
- Pull Model: Pull models involve centralized collectors periodically polling or scraping logs from configured sources using network shares, APIs, database queries, or system log interfaces.
Comparison of Push vs. Pull Models:
| Feature | Push Model | Pull Model |
|---|---|---|
| Initiator | Source system pushes logs | Collector pulls logs |
| Reliability | Depends on network; agents buffer locally | Collector handles retries and scheduling |
| Scalability | Scales with edge agent deployment | May struggle with large-scale polling |
| Latency | Low latency (near real-time) | Higher latency due to polling intervals |
| Complexity | Higher (agent install, configuration) | Lower (centralized control) |
| Resource Usage | Distributed across sources | Concentrated at collector |
When to use each approach:
- Push: Preferable for real-time data requirements, high reliability needs, and flexible log processing scenarios
- Pull: Works best in controlled environments, third-party systems without agent support, or centralized management preferences
Examples of tools:
- Push: Fluentd, Filebeat, Logstash Forwarder, Vector, Edge Delta
- Pull: Promtail (Grafana Loki), AWS CloudWatch Logs Insights, Telegraf, Edge Delta
Each log collection method serves specific purposes depending on system architecture, security requirements, and scalability needs. Well-designed logging pipelines often combine multiple methods to achieve comprehensive visibility while optimizing resource utilization.
Log Collection Architecture Patterns
Effective log collection architecture directly impacts observability system performance, scalability, and reliability. Whether managing monolithic applications, microservices, or IoT device networks, the chosen architecture pattern influences data flow efficiency, storage costs, and analytical capabilities.
Centralized Collection
Centralized log collection consolidates logs from various sources into a single server or platform, such as the ELK Stack (Elasticsearch, Logstash, Kibana), Graylog, or Fluentd-based solutions.
[App1] [App2] [App3]
\ | /
\ | /
[Central Log Aggregator]
|
[Storage & Search]
This architecture provides unified visibility across infrastructure, simplifying troubleshooting workflows, event correlation, and log retention policy management. It’s particularly effective for small- to medium-sized organizations due to setup simplicity and lower operational overhead.
Centralized systems ingest logs from diverse sources, including:
- Rsyslog
- Journald
- Windows Event Logs
- Proprietary application formats
These logs are parsed and structured into consistent, machine-readable schemas, often using JSON or other standardized formats for downstream processing.
However, as systems scale, storage and processing become significant concerns. High-volume environments generating terabytes of daily logs face storage bottlenecks, processing delays, and increased infrastructure costs. Compression, intelligent rotation policies, and ingest filtering help manage this load effectively.
Modern centralized platforms often enrich logs with contextual metadata and support advanced features like:
- Full-text search
- Real-time alerting
- Customizable dashboards
- AI-driven event correlation.
They integrate seamlessly with SIEM and SOAR tools for comprehensive security monitoring and automated incident response.
Distributed Collection
Distributed log collection addresses large-scale, microservices-based, or globally distributed environments through multi-tier pipelines involving regional agents, intermediate aggregators, and centralized storage systems.
In this architecture, logs from each service are collected locally, enriched with environment-specific metadata (service name, region, version), and forwarded to centralized systems for storage and analysis. Correlation IDs enable engineers to trace individual requests across multiple services, essential for debugging complex microservices interactions.
Distributed logging enables:
- Horizontal scalability across geographic regions and cloud environments
- Faster incident response through localized processing and centralized correlation
- Enhanced compliance through distributed data sovereignty and centralized audit capabilities
- Improved reliability via redundant collection points and failover mechanisms
Best practices include structured logging (preferably JSON), intelligent log-level filtering, robust security controls with encryption and access management, and standardized metadata schemas. Tools like Fluent Bit, Vector, OpenTelemetry Collector, and Apache Kafka commonly support this architecture pattern.
Edge Collection
Edge collection targets logs generated in remote, constrained, or intermittently connected environments such as IoT devices, branch offices, manufacturing facilities, or mobile deployments. This approach processes and pre-filters logs locally before selective transmission to central systems.
[IoT Device] –> [Local Collector] –(Filtered/Batched)–> [Cloud Aggregator]
This architecture ensures critical events are captured even during connectivity outages, with local buffering and intelligent filtering reducing bandwidth usage and transmission costs. Edge logging proves essential in scenarios like smart manufacturing, offshore oil platforms, retail point-of-sale systems, or remote monitoring stations where reliable central connectivity may be unavailable.
Edge collection brings several advantages:
- Offline resilience through local storage and processing capabilities
- Bandwidth optimization via local filtering and data compression
- Real-time analytics enabling immediate local decision-making
- Cost reduction by transmitting only high-value data to central systems
Edge Delta’s distributed architecture exemplifies this approach, enabling organizations to process and analyze data at the source while maintaining centralized visibility and control.
Key Considerations for Log Collection Implementation
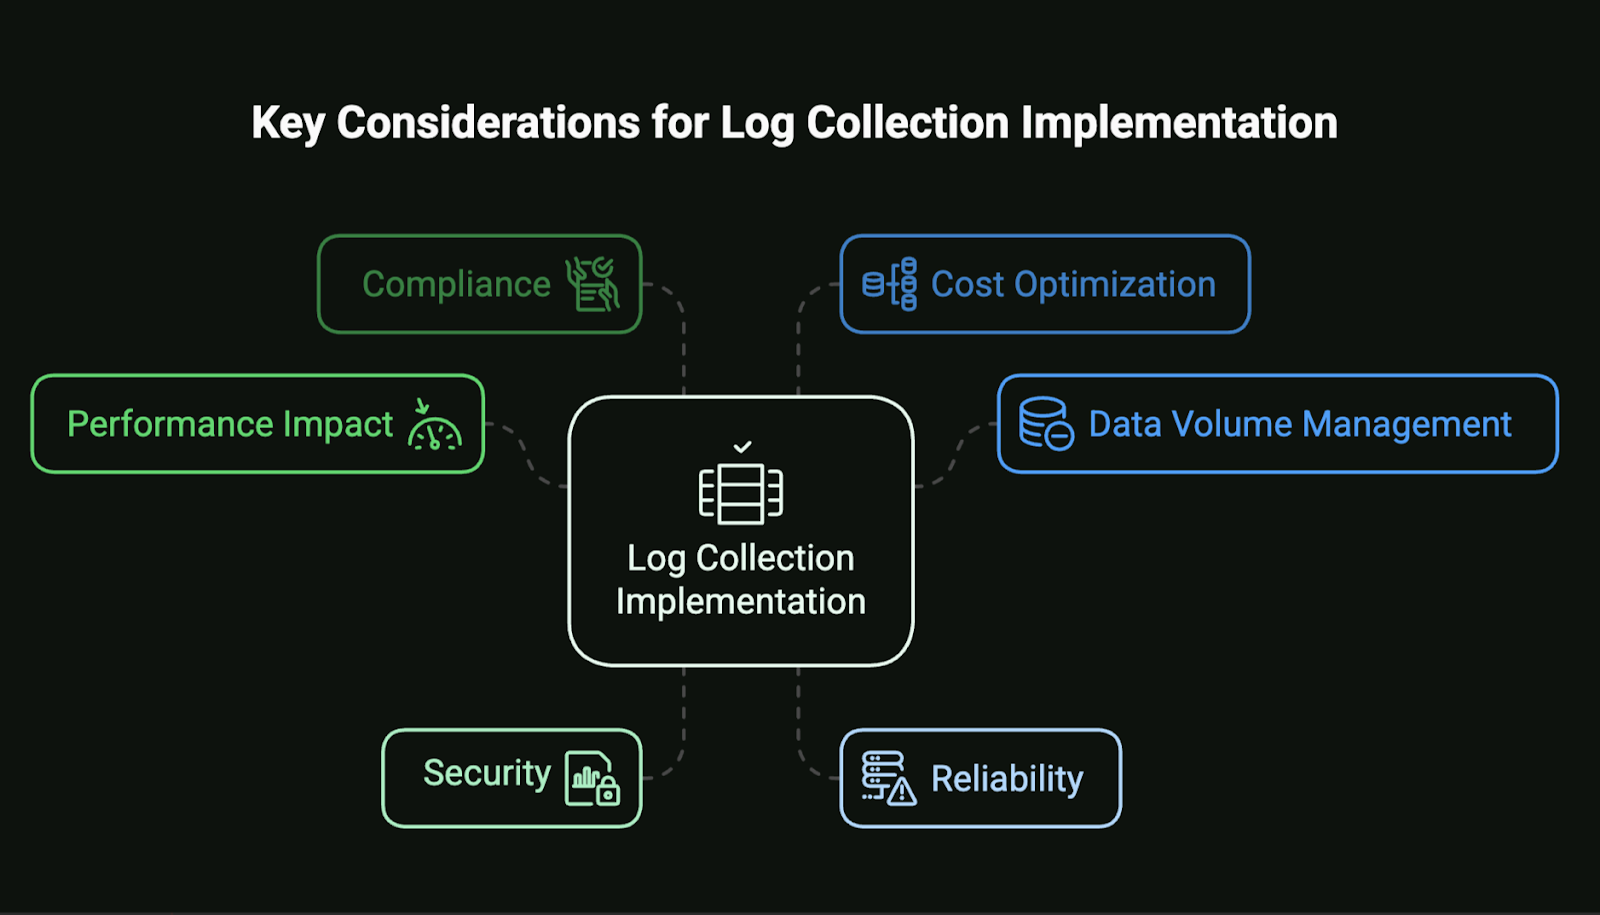
Implementing robust log collection requires careful planning beyond basic tool selection. Without strategic consideration of performance impact, data volume management, security requirements, and operational costs, logging systems can overwhelm infrastructure, expose sensitive information, or generate unsustainable expenses.
Performance Impact
Log collection can significantly affect system performance, particularly in high-throughput environments where excessive or poorly configured logging strains CPU, memory, and network resources, potentially degrading application performance.
Best practices:
- Implement asynchronous logging and memory buffering to minimize blocking I/O operations
- Batch high-frequency events to reduce write frequency and improve throughput
- Isolate logging operations using dedicated queues or I/O channels to prevent interference with core application threads
- Monitor system resource usage to detect logging-induced performance degradation
Data Volume Management
Uncontrolled logging generates “log noise” — low-value data that inflates storage costs and obscures important events. Excessive log volume can also cause performance issues in downstream analysis and search systems.
Best practices:
- Apply intelligent filtering to eliminate repetitive or low-priority entries (e.g., successful HTTP 200 responses)
- Implement sampling strategies for high-volume debug logs while preserving error and warning messages
- Enable compression (e.g., gzip, lz4) to reduce log size during transmission and storage
- Establish log rotation policies with appropriate retention periods based on business value
Security
Log data often contains sensitive information, including user activity, authentication tokens, IP addresses, and internal system details. Mishandled log data creates significant security and privacy risks.
Best practices:
- Encrypt logs in transit using TLS/SSL and at rest using managed encryption keys
- Implement role-based access control (RBAC) and strong authentication for log access
- Sanitize sensitive data by scrubbing or redacting secrets, personally identifiable information (PII), and credentials before external storage
- Maintain audit trails for log access and modifications to support forensic investigations
Reliability
Critical log data must be collected and preserved even during system failures, network outages, or service disruptions to maintain operational visibility and compliance requirements.
Best practices:
- Deploy tools with local buffering capabilities, like Fluent Bit or Logstash for disk-based storage during outages
- Configure retry mechanisms and delivery acknowledgments to prevent data loss
- Monitor the collection pipeline health, including dropped events, forwarding delays, and agent status
- Implement redundant collection paths for critical log sources
Compliance
Organizations in regulated industries must demonstrate proper control over log data handling, retention, and access to meet legal and regulatory requirements.
Best practices:
- Establish retention policies based on regulatory requirements (e.g., 90 days for operational logs, 1-7 years for security logs)
- Ensure geographic data sovereignty by storing logs within appropriate regions for GDPR, data residency laws
- Maintain immutable audit trails for forensic analysis and legal validation
- Document data handling procedures and access controls for compliance audits
Cost Optimization
Log collection and storage costs can escalate rapidly in high-volume environments, especially with commercial observability platforms that charge based on data ingestion or storage volumes.
Best practices:
- Implement tiered storage strategies with recent logs in high-performance systems and archived logs in cost-effective cold storage
- Leverage budget-friendly archival storage like Amazon S3 Glacier, Google Cloud Archive, or Azure Cool Storage
- Choose licensing models (volume-based vs. agent-based) that align with organizational traffic patterns and growth projections
- Regular cost monitoring and optimization through intelligent telemetry pipelines that filter data before ingestion
Popular Log Collection Tools and Platforms
The log collection ecosystem encompasses diverse tools designed for different use cases, infrastructure types, and organizational requirements. These solutions typically fall into three categories: open-source tools, commercial platforms, and cloud-native services, each offering distinct capabilities and trade-offs.
Open Source Tools
Open-source solutions provide flexibility, transparency, and cost efficiency, making them popular choices for organizations needing control over their log pipelines and that are comfortable managing underlying infrastructure.
ELK Stack (Elasticsearch, Logstash, Kibana): The most widely adopted combination for log ingestion, search, and visualization in enterprise environments.
- Logstash handles complex parsing, transformation, and enrichment
- Elasticsearch provides distributed indexing and search capabilities
- Kibana offers rich dashboards and visual data exploration
Fluentd: A lightweight, high-performance log collector with an extensive plugin ecosystem for data sources and destinations. Known for unifying data collection and routing across heterogeneous systems with minimal resource overhead.
Grafana Loki: A horizontally scalable log aggregation system optimized for Kubernetes environments and tightly integrated with Grafana dashboards. Loki’s approach of indexing only metadata reduces storage costs compared to full-text indexing solutions.
Commercial Platforms
Commercial platforms offer enterprise-ready solutions with comprehensive feature sets, built-in security controls, and professional support, preferred by organizations requiring rapid deployment and scalable observability without infrastructure management overhead.
- Splunk: Industry-leading platform renowned for powerful search analytics, machine learning capabilities, and extensive use cases spanning security operations, IT monitoring, and business intelligence.
- Datadog: Integrated observability platform combining log collection with metrics, traces, and synthetic monitoring in a unified interface, popular for cloud-native and microservices environments.
- Edge Delta: Modern observability platform supporting logs, metrics, and traces with AI-powered anomaly detection. Built off of the collection, processing, and routing performed by Edge Delta’s intelligent Telemetry Pipelines, the Edge Delta platform provides cost-effective observability at scale with automated insights and AI assistance.
- New Relic: Full-stack observability solution that combines log management with application performance monitoring and infrastructure visibility in a single platform.
- Sumo Logic: Cloud-native platform designed for real-time analytics, security insights, and compliance reporting with built-in machine learning and threat detection capabilities.
Cloud-Native Services
Cloud-native services integrate seamlessly with major cloud providers, offering simple setup, automatic scaling, and native connectivity with cloud resources, ideal for cloud-first or hybrid organizations.
- AWS CloudWatch: Comprehensive monitoring service that collects and tracks metrics, monitors log files, and sets alarms across AWS services with integrated billing and cost optimization features.
- Azure Monitor: Centralized platform for collecting, analyzing, and acting on telemetry from cloud and on-premises environments with AI-powered insights and automated response capabilities.
- Google Cloud Logging: Real-time log management service with built-in filtering, alerting, and integration with Google Cloud’s AI and analytics services for advanced log analysis.
Choosing the Right Tool
Selecting appropriate log collection tools requires evaluating technical requirements, integration needs, operational constraints, and long-term strategic objectives. Consider these critical factors:
- Deployment and Management Complexity: Assess team expertise, available resources, and preference for managed vs. self-hosted solutions.
- Data Format Support: Ensure compatibility with structured and unstructured data sources across your technology stack.
- Integration Ecosystem: Evaluate compatibility with existing tools, APIs, and platforms in your observability and security infrastructure.
- Scalability and Performance: Consider current data volumes, growth projections, and performance requirements for real-time vs. batch processing.
- Plugin and Extension Availability: Assess ecosystem richness, community support, and ability to customize functionality for specific use cases.
- Control vs. Convenience Trade-offs: Balance operational control and customization needs against simplicity and managed service benefits.
The optimal choice depends on organizational infrastructure, in-house expertise, operational goals, and strategic observability requirements.
Best Practices for Effective Log Collection
Implementing reliable and scalable log collection requires strategic planning beyond tool selection. These actionable best practices help optimize log pipelines from initial deployment through long-term operation.
Start with a Strategic Log Collection Plan
Identify critical logs first by prioritizing high-value data such as authentication events, API calls, error conditions, and security incidents before attempting to collect everything. This focused approach reduces noise and ensures visibility into key operational and security events that directly impact business operations.
Establish clear objectives for log collection, including troubleshooting requirements, security monitoring needs, compliance mandates, and performance monitoring goals to guide implementation decisions.
Implement Structured Logging
Standardize log formats using consistent, machine-readable structures like JSON with clear key-value pairs for essential fields, including:
- Timestamp
- Severity level
- User_id, event_type
- Source_system
This approach dramatically improves parsing efficiency, indexing performance, and search capabilities across diverse log sources.
Define schema standards early in development to ensure consistency across applications, services, and infrastructure components, reducing downstream processing complexity.
Standardize Timestamps and Time Zones
Use uniform timestamp formats (ISO 8601 recommended) and consistent time zones (typically UTC) across all log sources. This critical practice prevents temporal misalignment during log correlation and simplifies troubleshooting across distributed environments spanning multiple geographic regions.
Implement time synchronization (NTP) across all infrastructure to ensure accurate event ordering and correlation capabilities.
Plan for Scalability
Design log pipelines for future growth using message queues like Apache Kafka, Redis Streams, or cloud-native solutions to buffer and route large data volumes without bottlenecks. Implement distributed log collection architectures that can scale horizontally as data volumes increase.
Consider data tiering strategies that automatically move older logs to cost-effective storage while maintaining recent data in high-performance systems for real-time analysis.
Establish Retention Policies Early
Define retention periods based on business requirements, legal obligations, and compliance mandates. Security logs might require retention for 1-7 years, while debug logs can be purged after 30 days to control storage costs and improve system performance.
Automate lifecycle management with policies that automatically archive, compress, or delete logs based on age, importance, and regulatory requirements.
Monitor Your Monitoring System
Continuously monitor log collection pipeline health using metrics like ingestion rate, dropped events, parsing errors, and storage utilization to detect issues before they affect observability capabilities.
Common Challenges and Solutions
Implementing reliable log collection involves overcoming technical and operational obstacles that can undermine system effectiveness, inflate costs, and create security vulnerabilities. As systems scale and become more distributed, teams face persistent challenges including data overload, performance degradation, format inconsistencies, compliance complexities, and tool proliferation.
Challenge 1: Log Volume Explosion
Modern applications generate massive log volumes from microservices, containers, databases, and user interactions. Collecting every event floods storage systems, degrades search performance, and inflates costs while burying important signals in noise.
Solution: Implement intelligent volume reduction through filtering and sampling strategies. In production environments, focus collection on errors, warnings, and key business transactions while sampling routine operational logs. Use adaptive sampling that increases collection rates during incidents and reduces them during normal operations. Modern observability platforms provide automated filtering and intelligent data reduction capabilities.
Challenge 2: Performance Degradation
High log collection rates can strain disk I/O, memory, and CPU resources, especially with verbose logging configurations or large payload sizes. This resource pressure can degrade application performance and potentially cause service interruptions.
Solution: Optimize logging operations using buffered and asynchronous writes to minimize blocking operations. In NGINX deployments, configure buffer=32k and flush=5s parameters to reduce I/O load. Avoid verbose debug logging in production unless actively troubleshooting specific issues. Monitor both application performance metrics and logging pipeline health to identify hidden performance impacts early.
Challenge 3: Data Quality Issues
Inconsistent, malformed, or unstructured logs complicate downstream analysis and correlation. Parsing failures and schema drift commonly occur when logs originate from diverse sources without standardized formats or proper validation.
Solution: Enforce structured logging standards and implement schema validation across all log sources. Adopt JSON formatting with consistent field naming conventions to ensure logs are parseable and queryable. Implement data validation at collection points to catch format errors early. Tools like Elasticsearch and modern log management platforms work optimally with well-structured, validated log data.
Challenge 4: Compliance Complexity
Log data frequently contains sensitive information, including:
- User activity patterns
- IP addresses
- Access credentials
- System vulnerabilities
Regulatory frameworks like GDPR, HIPAA, and PCI-DSS require organizations to secure logs, restrict access, and maintain them only for defined periods. Without proper controls, organizations risk compliance violations, audit failures, and potential data breaches.
Solution: Deploy log collection tools with built-in compliance features, including automated retention management, encryption capabilities, and comprehensive access auditing. Automate sensitive data redaction, implement geographic data residency controls, and maintain immutable audit trails. These automated approaches reduce manual errors and ensure consistent compliance across logging infrastructure.
Challenge 5: Tool Sprawl
As infrastructure expands, teams often deploy different log collectors for various services and environments, leading to:
- Inconsistent data formats
- Duplicated processing pipelines
- Increased maintenance overhead
This fragmentation complicates cross-system correlation and slows incident response times.
Solution: Consolidate log collection using unified platforms that support logs, metrics, and traces through standardized protocols like OpenTelemetry. This approach simplifies operational management, improves data consistency, and enables comprehensive observability across the entire technology stack. Unified platforms reduce complexity while improving visibility and troubleshooting capabilities.
Conclusion
Log collection forms the backbone of modern observability and security operations, enabling organizations to maintain visibility, ensure compliance, and respond rapidly to incidents across increasingly complex distributed systems. As infrastructure expands across cloud, on-premises, and edge environments, strategic log collection becomes essential for operational success and competitive advantage.
Each log collection method — whether agent-based, agentless, hybrid, push, or pull — offers distinct advantages suited to different operational requirements, system constraints, and scalability needs. Many successful organizations implement multiple collection approaches to optimize coverage, performance, and cost-effectiveness across diverse infrastructure components.
Frequently Asked Questions About Log Collection
What’s the difference between log collection and log analysis?
Log collection involves capturing and centralizing log data from systems, applications, and networks into unified storage systems. Log analysis goes further by interpreting collected data to identify trends, detect security threats, troubleshoot operational issues, and support business decision-making through advanced analytics and correlation techniques.
How does a log collector work?
A log collector aggregates log data from multiple sources, including servers, applications, and network devices. It normalizes diverse data formats, applies filtering and enrichment rules, then forwards processed data to centralized systems for indexing, visualization, and alerting, enabling both real-time monitoring and historical analysis capabilities.
How much storage is needed for log collection?
Storage requirements depend on log volume, retention periods, compression ratios, and backup policies. A typical enterprise environment might require 250 GB to several terabytes of storage capacity, but high-traffic environments generating hundreds of gigabytes daily may demand petabyte-scale storage for indexing, long-term archival, and redundancy purposes.
Is log collection GDPR or HIPAA compliant?
Log collection can achieve GDPR or HIPAA compliance when logs are properly encrypted, access-controlled, and contain only necessary data for legitimate business purposes. Sensitive personal information must be protected through anonymization or pseudonymization techniques, and comprehensive audit trails must meet regulatory transparency and accountability requirements.
What sensitive data should be excluded from log collection?
To reduce privacy risks and ensure regulatory compliance, avoid collecting unencrypted personal data, including full names, addresses, email addresses, IP addresses, financial records, medical information, social security numbers, and authentication credentials, unless strictly necessary for legitimate business purposes and properly secured through encryption and access controls.

