


Observability, at a high level, is defined as the process of using external outputs to evaluate the internal state of a system. In the IT space, teams employ observability to ensure their system applications and infrastructure are running smoothly by collecting and analyzing generated data in the form of logs, metrics, and traces. This process is crucial for managing modern distributed systems and complex multi-cloud IT operations.
Understanding the observability fundamentals is key to creating a functional observability solution to monitor your workloads. With knowledge of the core observability principles, you can build reliable, maintainable and efficient systems to keep your applications running.
Key Takeaways
-
Observability is the ability to measure a system’s current state, based on data generated from metrics, events, logs, and traces. It’s a crucial aspect in maintaining the health and performance of a system or application.
-
To leverage its full potential, teams must follow five core observability principles.
- Comprehensive data collection
- Real-time monitoring
- Correlation and contextual analysis
- User-centric insights
- Automation and Scalability
-
Following observability principles allows organizations to improve their system reliability, performance optimization, incident management, and decision-making.
Five Core Principles of Observability
In this blog post, we will break down five of the core observability principles, each of which are important to follow when integrating an observability solution into your environments.
Principle 1: Comprehensive Data Collection
Comprehensive data collection is key to unlocking the full power of your observability solution. Gathering comprehensive information from all system components provides overall visibility into the system’s behavior, and by gathering diverse data teams can see hidden patterns and correlations. These insights are the key to effective diagnosis and issue resolution.
Type of Log DataDescriptionLogDetailed records of events and actions in a system or applicationMetricQuantitative measurements of a system’s performanceTracesRecords of the execution path of requests in a system
Logs
Logs are records of historical events within the organization’s software application, systems, and network. They are an incredibly important leg of the observability stool, as they provide insights on an extremely granular level. Logs are generated chronologically to provide a comprehensive list of activities, errors, and incidents, to help you understand:
- What happened?
- When did it happen?
- Why did it happen?
Metrics
Metrics are numerical values which describe the state or behavior of a system component. They can be derived by aggregating numerical data across diverse events over time, or collected directly from data like cpu usage, latency, saturation, and more. Metrics give organizations detailed context to maintain manageable resource consumption levels, and can measure a wide variety of things, including:
- The number of concurrently handled requests
- The amount of processed HTTP requests
- The total time spent processing requests
- CPU, memory, or disk usage
- The number of errors encountered
Monitoring observability metrics gives you a high level overview of the health of your system, and enables you to catch potential issues before they become massive production issues.
Traces
Traces are crucial for understanding the behavior of and optimizing intricate software systems. At a high level, traces track the flow of a request as it travels through your system. They are often leveraged by teams running distributed architectures, as requests traveling between distributed services are far more complex than those running in traditional environments. With this data, organizations can have an in-depth view of their application’s performance.
Tracing provides insight into the origin and nature of issues by revealing:
- The specific functions/services involved (each one “hit” by a request is referred to as a span)
- The extent of each function/service execution reached by the user
- Any relevant parameters
- Execution duration
With trace/span data, you can immediately hone in on bottlenecks and swiftly fix the underlying service, to ensure your applications remain running and achieve distributed observability.
Principle 2: Correlation and Contextual Analysis
Correlating and contextualizing data is crucial for understanding the connections between events and system components. With it, teams can view issues in a variety of different ways, and as a result identify underlying root causes much quicker. No piece of data lives in isolation – it belongs with other logs or metrics, or under spans in traces associated with the same underlying issue. With correlation and contextualization, you can immediately understanding the system’s bigger picture.
For instance, organizations with massive operations will have high volumes of logs, metrics, and traces. To effectively troubleshoot issues, their teams must understand and control all their observability data, a large portion of which involves understanding the connections between different pieces of telemetry data. This way, teams can better understand patterns and predict future anomalies.
Here are some ways to better understand system component relationships and correlations:
- Data Interdependencies: Understanding how different data types connect and interact with each other
- Contextual Insight Implementation: Leveraging contextual data to determine symptoms and root causes for accurate diagnostics
- System Mapping: Developing a logical and visual map of system components and their interactions to understand how one area affects another
Principle 3: Real-Time Monitoring and Alerting
Real-time monitoring offers immediate and reliable insights into a system’s health and performance. As a downstream effect, this process also enables alerting, which notifies teams of sudden system changes for proactive maintenance and quick issue resolution. Monitoring and alerting processes reduce errors and prevent minor ones from escalating in the future.
There are a few key parts involved in the monitoring and alerting process:
- Continuous Monitoring: Keeping track of system performance and monitor system health 24/7
- Baselines and Thresholds: Using key metrics to detect deviations that can indicate potential problems and issues
- Automated Alerts: Configuring automated alerts to notify relevant teams instantly when anomalies are detected
Principle 4: User-Centric Insights
Implementing a user-centric experience is crucial for maintaining the effectiveness of an observability solution. Observability tools provide insights, trends, and visualizations of system performance and issues impacting end users in a smooth and intuitive way. Prioritizing user-centric metrics ensures that organization systems deliver a high-quality user experience, and includes focusing on:
- User behavior analysis: Analyze user behavior data to understand how users interact with the system and see areas of improvement.
- User feedback: Collects and analyzes user feedback to gain insights into user satisfaction.
- Personalized insights: Provide personalized insights that cater to distinct user details based on their unique needs and preferences
Principle 5: Automation and Scalability
Automation in observability practices ensure scalability and consistent monitoring and analysis performance. Additionally, automated processes can enhance efficiency and reduce human errors with no impact on effectiveness. One such example is Edge Delta’s automated anomaly detection. It allows issues to be identified within seconds without any low-level implementation needed, which is crucial as early detection minimizes damage (such as revenue loss from application downtime).
Continue reading to learn more about the importance of following these observability principles.
Pro Tip
You can spot anomalies easily with Edge Delta. Our anomaly detection leverages AI and ML for faster anomaly detection and also offers faster troubleshooting with AI recommendations.
Significance of Observability Principles
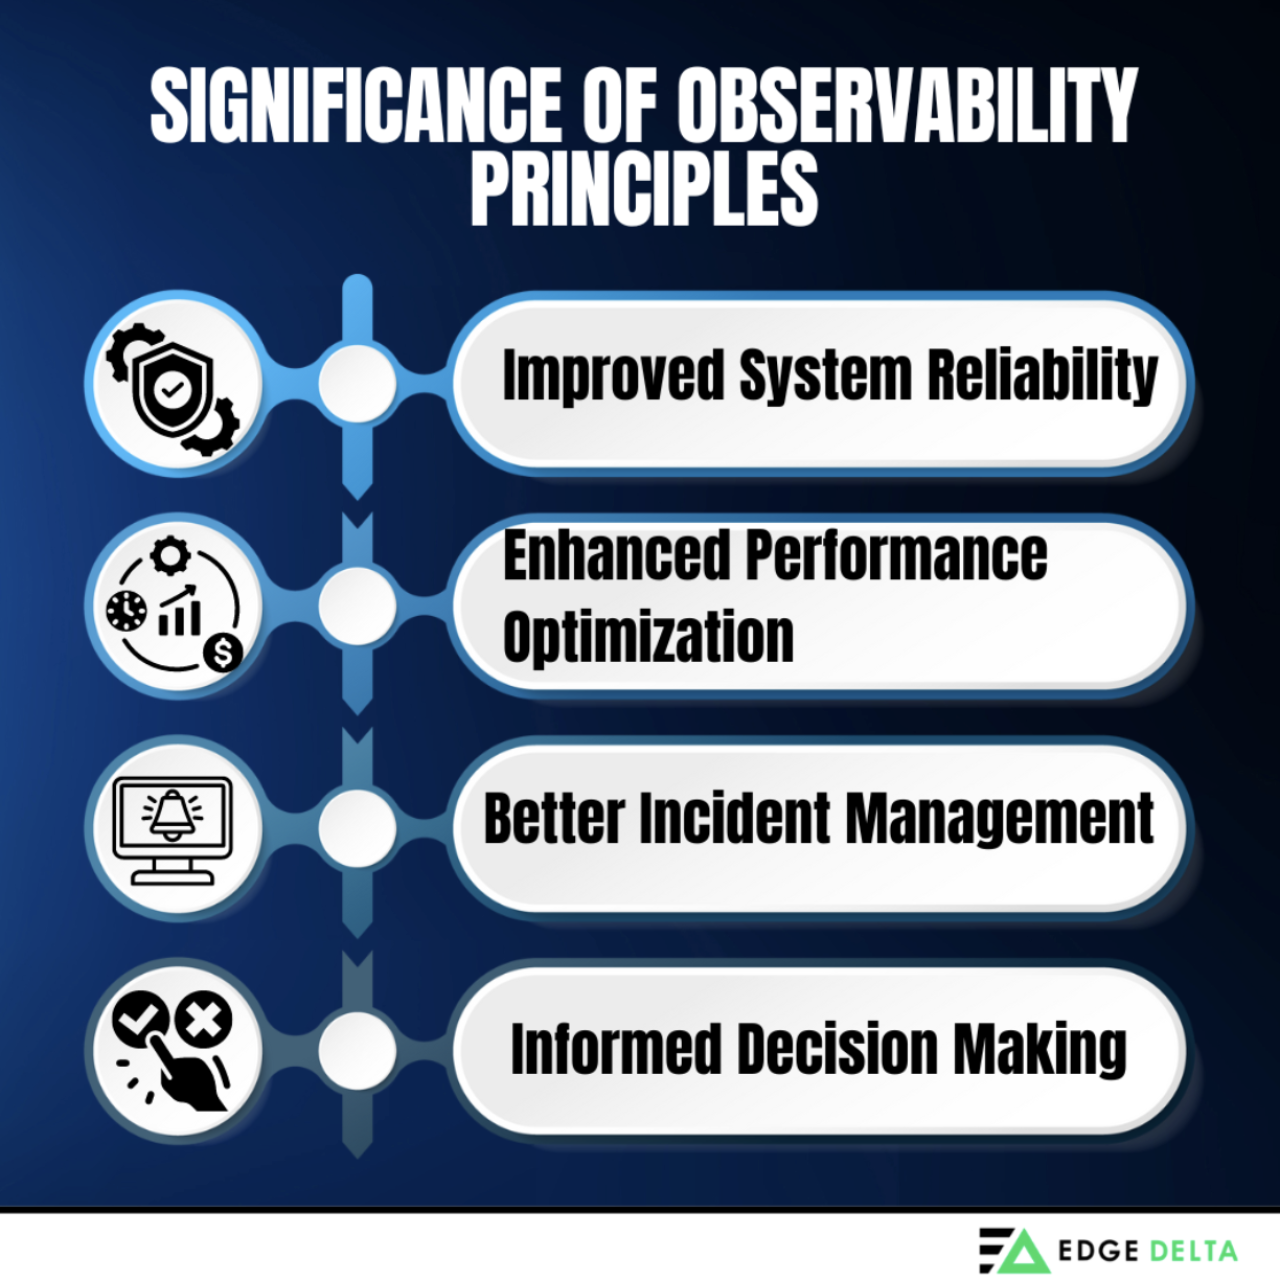
Improved System Reliability
Adhering to observability principles can significantly enhance system reliability by enabling early problem detection and rapid issue resolution.
- Early detection of issues: Comprehensive observability provides continuous monitoring to detect potential errors before they escalate
- Rapid resolution: Comprehensive observability enables quick identification of the root cause of issues and facilitates fast resolutions
One example of the significance of improving system reliability could be:
A digital e-commerce platform uses observability tools to monitor transaction processes. These tools can detect potential outages during shopping hours, such as slow transaction queues, prompting immediate investigation and resolution, with minimal impact to customers.
Enhanced Performance
Enhancing and optimizing system performance is paramount for delivering top-notch user experiences and implementing operational efficiency. Observability principles are pivotal for performance optimization, providing a deep understanding into and creating data-driven insights about the system’s behavior.
- Proactive optimization: Enables teams to assess system performance and enforce proactive optimizations
- Data-driven insights: Delivers detailed logs and metrics highlighting the system’s inefficiencies and bottlenecks
Better Incident Management
Effective organizational incident management is essential for minimizing downtime and maintaining service quality. Observability principles ensure the delivery of real-time monitoring, alerting, and contextual analysis for better incident management. Additionally, automated incident response can significantly reduce resolution time and manual intervention.
- Contextual analysis: Provides contextual information that delivers an in-depth interpretation of the impact and extent of the incident.
- Real-time monitoring: Critical for detecting and addressing problems and incidents when they occur.
Informed Decision Making
Making informed decisions is crucial for strategic planning and operational efficiency. Observability principles support team members in making informed decisions about their IT infrastructures.
Likewise, DevOps teams can make informed decisions about system architectures and operations by offering data-driven insights into system performance and behavior.
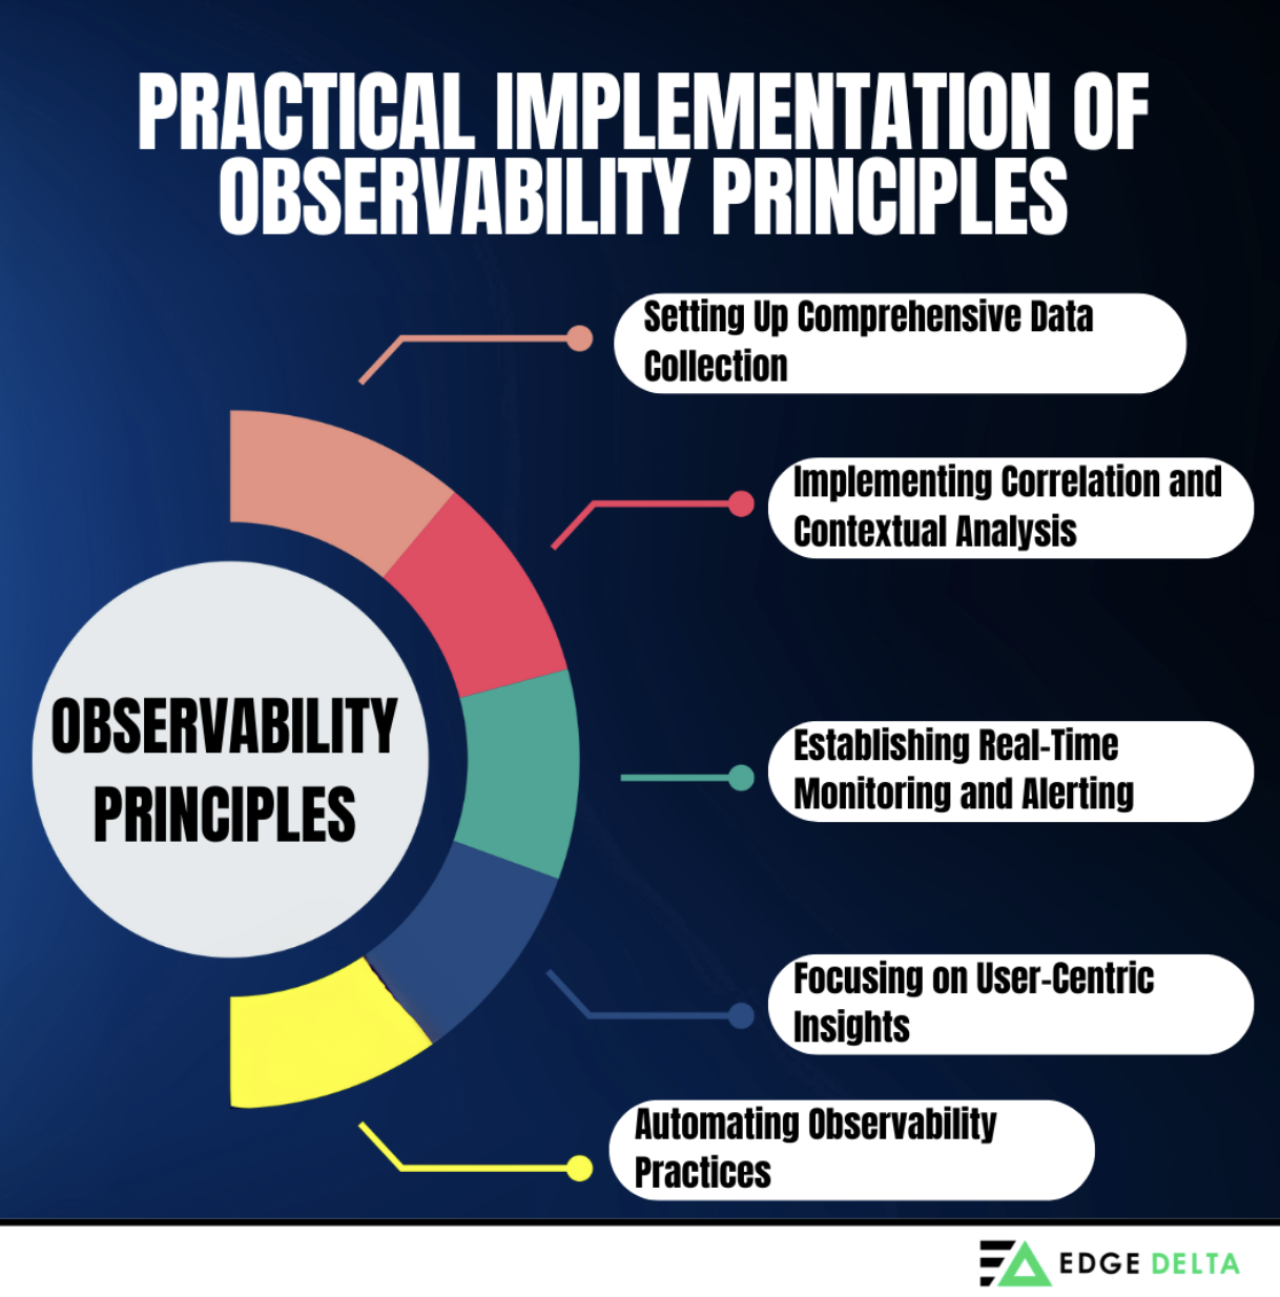
Practical Implementation of Observability Principles
Implementing observability principles into your practices increases system reliability, optimizes performance, and promotes the discovery of deep insights into system behavior. The key implementations steps include:
- Setting Up Comprehensive Data Collection
- Implementing Correlation and Contextual Analysis
- Establishing Real-Time Monitoring and Alerting
- Focusing on User-Centric Insights
- Automating Observability Practices
Read on to learn more about these practical steps and their implementation in the following section.
Setting Up Comprehensive Data Collection
Setting up a comprehensive data collection process takes some time and effort. It involves:
1. Selecting the Right Tools
Since every tool offers their own unique functions, it’s crucial to choose the one(s) that best fit your goals. Moreover, you should ensure the selected tool is compatible with your infrastructure or system.
Some popular open-source tools to consider are:
- Prometheus – For metrics
- ELK Stack (ElasticSearch, LogStash, and Kibana) – For logs
- Jaeger – For distributed tracing
2. Configuring Tools Appropriately
Once the tools are selected, it’s crucial to configure them properly. This step allows IT and DevOps teams to take a proactive approach for generating system insights. Additionally, they can leverage all options and capabilities for faster issue detection.
3. Implementing Best Practices
Implementing the best practices when setting up a comprehensive data collection results in better data utilization and accuracy. These practices include the following:
- Ensuring logs are searchable and accurately structured
- Deploying distributed tracing to determine request flow within a system
- Collecting key performance metrics such as response times, error rates, and performance metrics
Implementing Correlation and Contextual Analysis
During an outage, correlating logs from the organization’s web server with metrics from the database can help pinpoint the root cause of the issue. Organizations can also use the following techniques in their system:
- Tagging: Employ consistent tagging across logs, metrics, and traces to connect related data points.
- Dashboards: Build dashboards incorporating data from multiple sources, authorizing a unified view of system health.
- Use the Right Tools: For deeper analysis, use APM (Application Performance Management) tools like New Relic, Datadog, and Grafana for better visualization.
Establishing Real-Time Monitoring and Alerting
The process of establishing an effective alerting system and real-time monitoring involves the following practices:
- Setting up dashboards: Create real-time dashboards that let organizations visualize and display key metrics and logs. Example tools are Grafana and Kibana.
- Critical metrics alert configuration: Guarantee that alerts are actionable and provide descriptions and DTPs for problem resolution. Use tools like PagerDuty and Prometheus.
- Implementation of automated responses: Automate response messages to address issues quickly.
Focusing on User-Centric Insights
Concentrating on user-centric insights can guarantee that the organization’s systems are efficient and reliable. Additionally, it provides a seamless experience for end users requiring specialized tools and techniques.
- User experience metrics: Metrics showing user experiences, including page loads, error rates, and user interactions, are monitored.
- Implement Real User Monitoring (RUM) tools: These tools collect data directly from users’ browsers. This approach allows organizations to simulate user interactions while measuring performance.
Automating Observability Practices
Automating the processes of collecting, monitoring, and alerting on telemetry data can significantly reduce manual observability efforts. Additionally, it diminishes the risk of errors and ensures a consistent observability process across the organization. Implementing automation is helpful but requires appropriate tools and a strategic approach to integrate with your system seamlessly. This approach includes:
- Choose the best automation tools. Select compatible tools that can easily integrate with your system. Some examples of these tools include Chef, Terraform, and Ansible.
- Implement CI/CD Pipelines. These tools automatically deploy observability configurations and update applications.
- Write scripts for automation. Automate tasks like metric collection, log collection, and alert configuration.
Now that you have learned the practical implementations of observability principles, read on and learn the best practices in the following section.
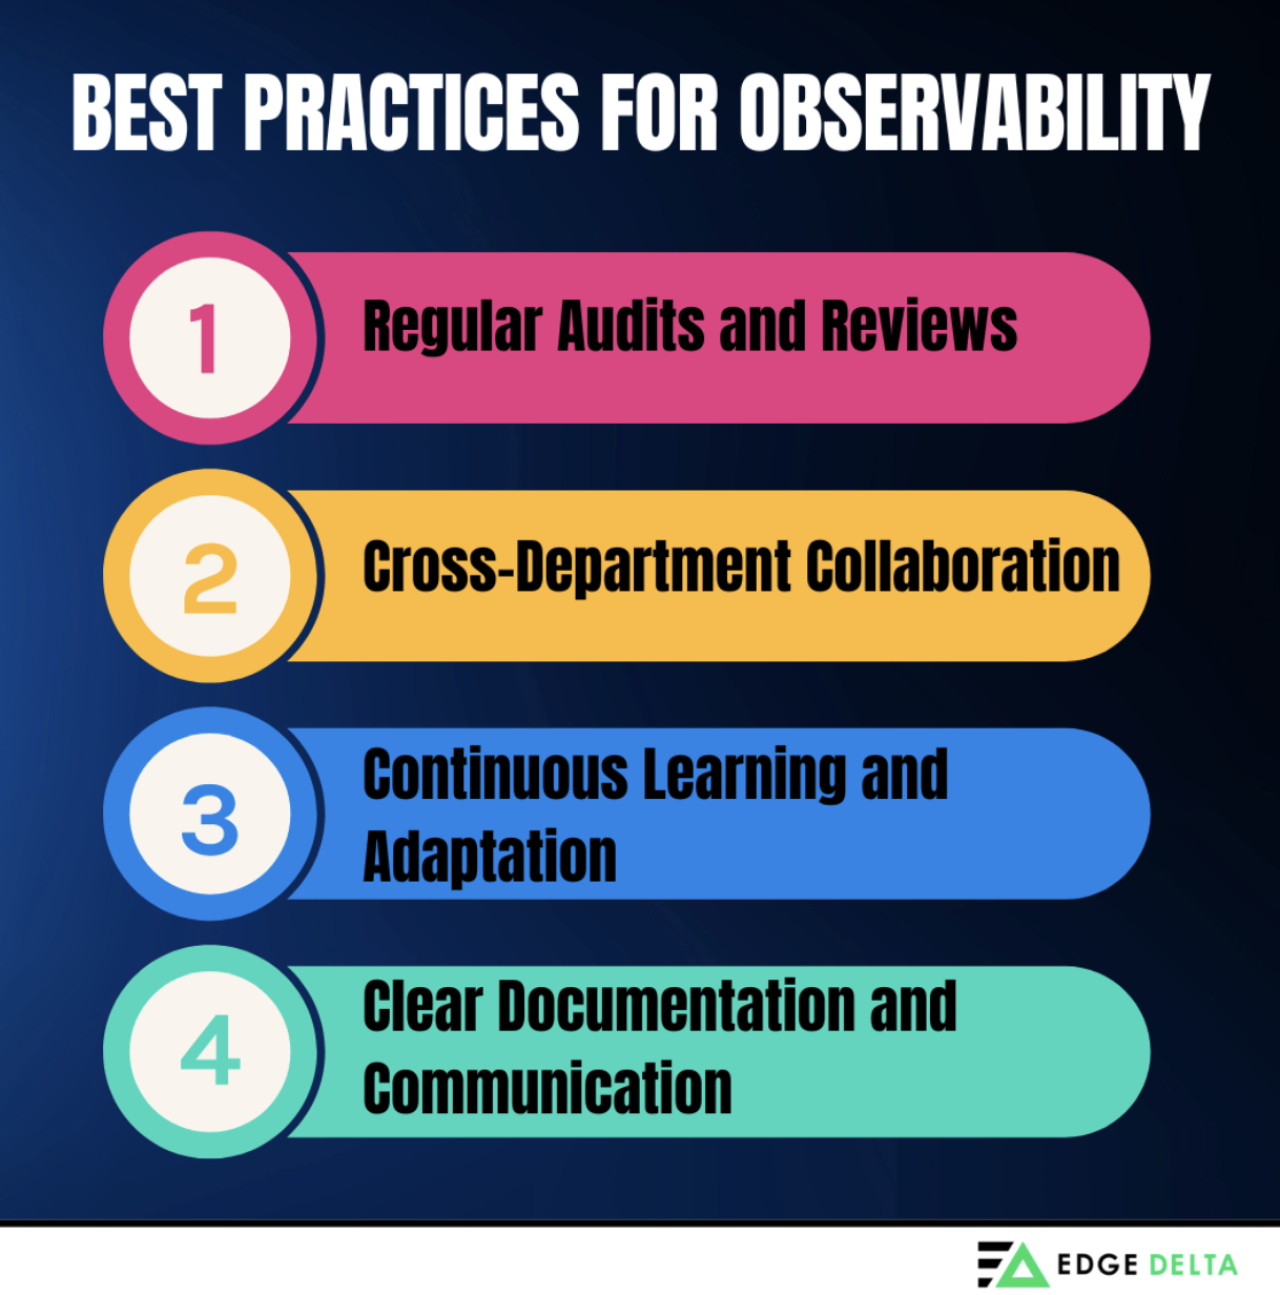
Best Practices for Observability
The best observability practices include:
- Regular Audits and Reviews
- Cross-Department Collaboration
- Continuous Learning and Adaptation
- Clear Documentation and Communication
1. Regular Audits and Reviews
Frequent audits and reviews are essential for properly maintaining an organization’s observability tools and practices. These evaluations help determine primary strengths, knowledge gaps, and key improvement areas.
To effectively implement audits, organizations should:
- Schedule systematic reviews to assess observability practices and tools.
- Employ checklists and benchmarks to evaluate the system performance and observability setup.
- Engage with teams and stakeholders for broader insight and feedback on the current system.
2. Cross-Department Collaboration
Collaboration ensures that data from diverse sources and departments are gathered and analyzed cohesively. It also promotes the interaction of different frameworks of thinking between different teams, a strong method for optimizing workflows and troubleshooting errors. Collaboration is essential as it can be implemented via:
- Regular inter-department meetings and discussions
- Sharing observability data
- Working together during the data analysis phase
3. Continuous Learning and Adaptation
Staying up to date is important for maintaining effective observability. Continuously adapting to technological changes, such as system and tool updates, is essential, and requires keeping your finger on the pulse for any critical updates, version changes, or necessary installs.
4. Clear Documentation and Communication
Documenting observability practices provides team members with a record of the essential information needed for consistency. Clear documentation helps new team members comprehend existing practices and integrate quickly. Here are the guidelines for adequate documentation and communication:
- Maintain detailed records of configurations, tools, and procedures
- Update the record regularly to reflect changes and improvement practices
- Communicate reports effectively and regularly across teams.
By following these practices, organizations can build and maintain a robust observability framework- enhancing their system performance effectiveness and reliability.
Wrap Up
Observability is crucial for understanding the complexities of modern network systems. By establishing a framework for implementing observability into your environment, you can follow best practices to ensure your observability solution runs smoothly and effectively, and focus your time and energy on what matters the most – your applications.
FAQs on Observability Principles
What are the key principles of observability?
The key principles of observability discussed in this blog post are: comprehensive data collection, correlation and contextual analysis, real-time monitoring and alerting, user-centric insights, and automation and scalability.
What are the three pillars of observability?
The three pillars of observability are logs, metrics, and traces.
What are the basic concepts of observability?
The basic concept of observability is understanding the internal behavior and performance of applications and systems from the external output, in the form of telemetry data.

