

Modern microservices evolve rapidly, making observability a growing challenge in distributed systems. Nearly 40% of organizations report that this complexity contributes to major outages—issues that are harder to detect and resolve without unified visibility. Teams need observability that scales with their architecture, not one that lags behind it.
In response, many collect more telemetry data—often with open-source tools. About 75% now use solutions like OpenTelemetry. But gathering large volumes of unstructured data often adds noise instead of clarity, slowing down root-cause analysis.
This guide shows how to use OpenTelemetry to unify logs, metrics, and traces, and how edge processing and sampling can control data volume and cost. The goal: meaningful, cost-efficient observability that helps you operate smarter — not just collect more data.
Key Takeaways
• Distributed observability improves speed by analyzing telemetry closer to its source.
• 40% of organizations link distributed system complexity to outages, proving that observability gaps directly impact reliability.
• Collecting structured telemetry enables faster detection, correlation, and root cause analysis across microservices.
Edge processing reduces data egress by up to 90%, lowering observability and storage costs.
• Intelligent sampling captures essential traces and minimizes noise from repetitive, low-value telemetry.
• 75% of teams use open source observability tools to gain flexibility and reduce vendor dependency.
• Defining Service Level Objectives aligns observability metrics with real user experience and reliability goals.
What Is Distributed Systems Observability?
Modern distributed systems are too complex to analyze in isolation. To understand what’s happening beneath the surface, teams depend on logs, metrics, and traces—the core pillars of observability—to interpret system behavior from the signals it produces.
The next sections define what observability really means and how it goes beyond traditional monitoring to reveal not just what is happening, but why.
Observability vs. Monitoring: Understanding the Difference
Observability serves as a diagnostic toolkit, allowing teams to correlate logs, metrics, and traces to uncover why a failure occurred—even when the issue follows an unexpected path. This empowers engineers to investigate problems without adding new instrumentation during an outage.
Monitoring, by contrast, functions as an early warning system. It tracks predefined metrics and triggers alerts when thresholds are exceeded, making it effective for known and predictable failure modes such as CPU saturation or rising error rates.
The following comparison highlights the key differences between these two approaches.
| Aspect | Monitoring | Observability |
|---|---|---|
| Focus | Known problems | Unknown issues, root cause |
| Data | Metrics (numbers, counters) | Metrics + logs + traces |
| Approach | Reactive | Proactive |
| Metrics | Predefined thresholds | Exploratory context |
| Outcome | System health status | Deep system understanding |
| Question | What is broken | Why is it broken |
| Analogy | Fire alarm | Fire investigation |
Why Observability Is Critical for Distributed Systems
Distributed systems span multiple services and environments, making it difficult to trace requests without a unified view. When visibility is limited, teams are forced to react to incidents with incomplete information. Even minor slowdowns in one service can cascade—triggering retries, overloading queues, and causing broader failures.
Observability provides real-time context, allowing teams to detect these patterns early and troubleshoot across all services from a single, connected view instead of juggling separate dashboards. This unified perspective delivers tangible operational benefits.
To illustrate its impact, here are the key outcomes observability enables:
| Benefit | Operational Impact |
|---|---|
| Complexity Management | Understand interactions across 100+ microservices |
| Faster MTTR | Resolve incidents faster with contextual, correlated data |
| Performance Optimization | Identify service bottlenecks before they affect users |
| Business Continuity | Detect and stop cascade failures before they impact critical paths |
The Evolution: From Monoliths to Microservices
System architecture has evolved from single, monolithic applications to distributed services—forcing teams to rethink how they monitor and troubleshoot production systems. Traditional monitoring remains useful but no longer reflects the complexity or dynamics of modern environments.
Here’s how today’s operational landscape has changed:
| Architecture Type | Operational Traits | Required Visibility |
|---|---|---|
| Monoliths | One codebase, local execution, linear request flow | Host-level metrics and basic logging |
| Microservices | Many services, network hops, async communication | End-to-end visibility across all components |
This shift creates challenges that traditional monitoring can’t fully address:
• A single user request may traverse dozens of services across multiple regions.
• Third-party APIs and edge functions introduce dependencies beyond direct control.
• Small failures can cascade across components, amplifying outages.
Observability addresses these issues by connecting signals across services, giving teams a complete, system-wide view rather than isolated snapshots.
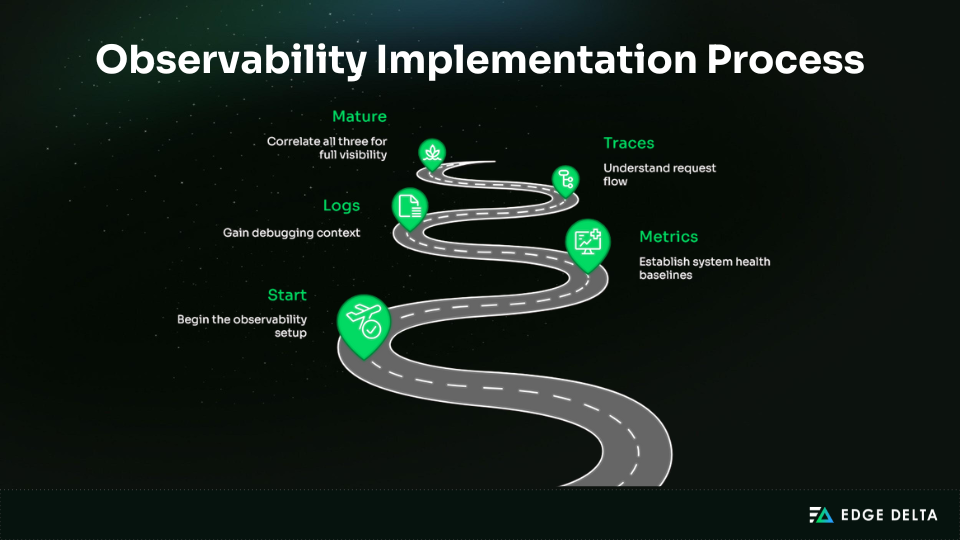
The Three Pillars of Observability
Logs, metrics, and traces are the three main parts of observability. Each one gives a different view of how the system works, and they’re most useful when set up thoughtfully.
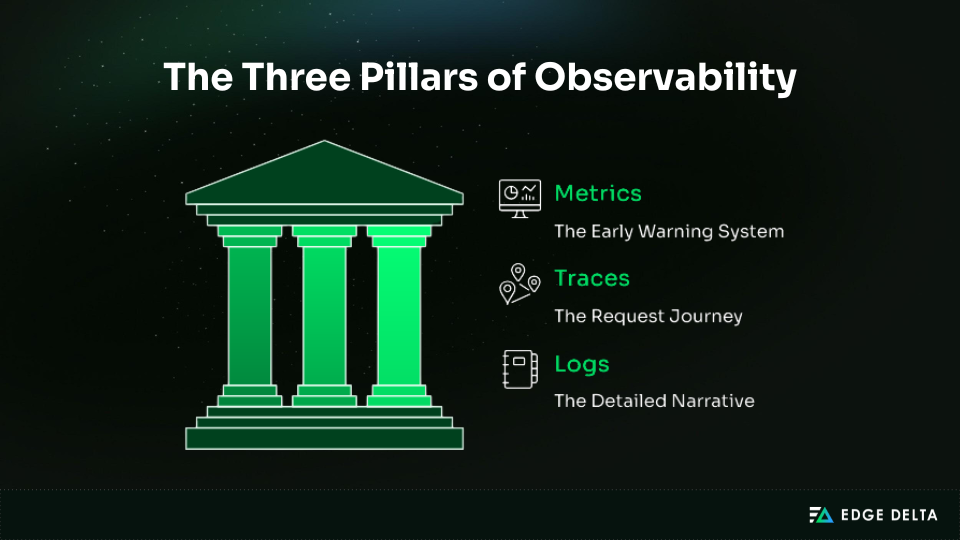
Pillar 1: Logs – The Detailed Event Records
Logs are timestamped records that show what happens inside a system. They can be plain text, structured JSON, or binary formats for high‑performance needs. Logs provide a chronological history of activity and are often the first place where issues appear.
Consistent formatting makes it easier to trace events, spot failures, and find root causes. Without structure, logs quickly become noise, hiding valuable insights.
Common log formats:
| Log Type | Format | Best Use Case | Example |
|---|---|---|---|
| Plain Text | Unstructured | Quick manual debugging | User login failed |
| Structured | JSON | Search and machine parsing | {"event":"login","status":"failed","user_id":123} |
| Binary | Protobuf, binlogs, journal | High-throughput pipelines | Database replication logs |
Best practices: Use structured JSON, include context like request ID and timestamp, and apply clear log levels. Don’t log sensitive data, generate excessive entries, or mix formats across services.
Pillar 2: Metrics – The Numerical Measurements
Metrics are numbers collected regularly to show how a system performs over time. Unlike logs, which record single events, metrics give an overall view that highlights trends and changes in performance across services.
By aggregating data, metrics enable teams to identify unusual patterns prior to them building up into incidents. They provide answers to questions like:
- How many requests are processed per second?
- How much CPU or memory is consumed?
- How response times change under load?
Metrics are easy to collect and visualize, making them the basis for most alerting systems. Common types of metrics include:
| Metric Type | Description | Example | Best Use |
|---|---|---|---|
| Counter | Grows continuously | Total HTTP requests, error count | Track cumulative events |
| Gauge | Moves up or down | CPU usage, active connections | Monitor current state |
| Histogram | Records distribution over time | Request duration (p50, p95, p99) | Spot latency patterns |
| Summary | Pre-aggregated histogram values | Response percentiles on client side | Reduce backend processing |
Aggregating metrics into time buckets (e.g., 10 seconds or 1 minute) helps teams establish baselines, track trends, and quickly identify deviations without sifting through raw data.
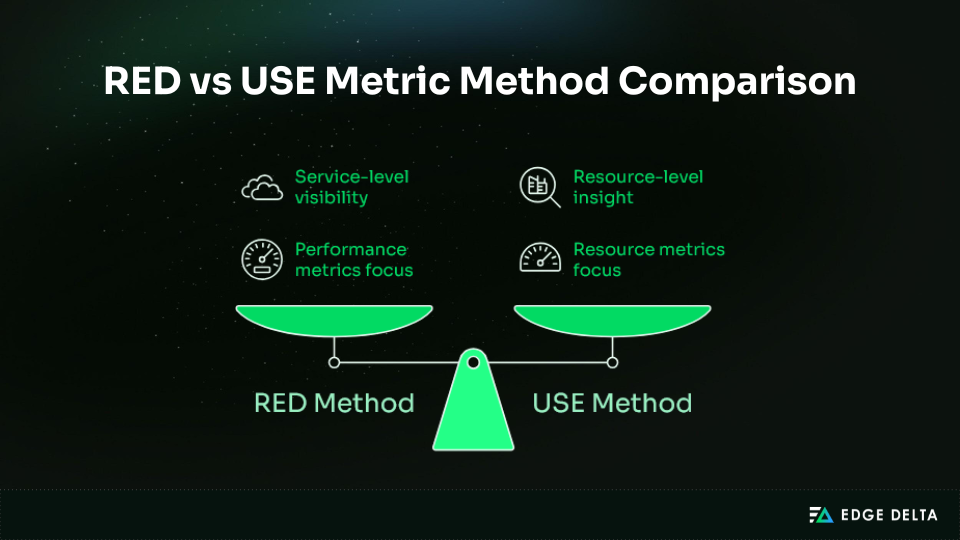
Two established models help define what to measure:
- RED Method (service-level): Rate, Errors, Duration
- USE Method (resource-level): Utilization, Saturation, Errors
These metrics provide early indicators of performance issues, giving teams quick warning signs before deeper investigation in logs or traces is needed.
Pillar 3: Traces – The Request Journey
Tracing tracks a request as it moves through different services in a distributed system. Each step is recorded as a span, and all the spans together make up a trace. This shows the full path of a single request and lets teams see:
- How components interact
- How long each step takes
- Where delays originate
A trace is similar to tracking a package as it passes through different checkpoints. Each checkpoint is like a service that handles part of the request, and the full journey shows where any delays or failures occurred.
Example Trace Timeline:
Request: Checkout Flow (Total: 285 ms)
- API Gateway: 50 ms
- Auth Service: 20 ms
- User Service: 100 ms
     - Database Query: 80 ms
     - Cache Check: 5 ms
- Response Assembly: 30 ms
The table below outlines the types of insights traces provide during investigation:
| What Traces Reveal | How It Helps Troubleshooting |
|---|---|
| Request path | Shows which services handled the request |
| Performance bottlenecks | Highlights the slowest span in the chain |
| Dependency behavior | Exposes how one service impacts another |
| Error propagation | Identifies where a failure started and how it spread |
How the Three Pillars Work Together
Each observability pillar supports a different stage of investigation: metrics reveal that something’s wrong, traces show where it occurs, and logs explain why it happened. By 2025, leading teams no longer manage these signals in isolation — they unify them through a single telemetry pipeline powered by OpenTelemetry.
This connected workflow enables teams to detect, pinpoint, and resolve issues faster. For example, when an API begins returning 500 errors, the investigation unfolds like this:
| Signal | Role in Investigation | Insight Gained |
|---|---|---|
| Metrics | Detect that something is wrong | Error rate on checkout API spikes from 0.1% to 15% |
| Traces | Reveal where the failure or slowdown occurs | Failing span identified between checkout-service and payment-gateway |
| Logs | Explain why it happened with exact event details | Log entry shows: Connection timeout to payment.example.com |
The trace highlights where the request failed in the service path, and the log confirms the specific error that occurred at that point.
- Root Cause: A payment gateway deployment caused a DNS failure.
- Resolution: Rollback and DNS correction applied.
- Time to Recover: 12 minutes instead of hours of manual correlation.
When all three signals work in sequence, teams get a clear progression from symptom to impact to cause. This reduces investigation time, prevents guess-driven debugging, and keeps incidents contained before they spread across services.
Key Observability Concepts You Must Understand
Before picking tools or building dashboards, it’s important to understand the main ideas behind observability. These basics affect cost, data quality, and how clear your signals are. Knowing them helps avoid common problems in large systems.
Cardinality and Its Impact on Costs
Cardinality refers to the number of unique values in a metric label or dimension. There are two types: low and high cardinality.
-
Low Cardinality:
status_codeonly has a few possible values (200, 404, 500). This produces a small number of time series, which is cheap and efficient. -
High Cardinality:
user_idorsession_idcan generate millions of unique combinations. High cardinality significantly impacts observability systems in three critical ways:- Storage usage: Every unique series consumes disk space.
- Query latency: More series make queries slower to execute.
- Memory load: Time-series databases keep each active series in memory.
Even small changes in how you label data can greatly increase storage needs. The example below shows how costs can rise fast when you include user-level identifiers.
| Label Set Example | Estimated Series Count | Storage Estimate (1KB per series/month) |
|---|---|---|
{method, status_code} | ~20 series | ~20KB per month |
{method, status_code, user_id, session_id} | 10M+ series | ~10GB per month |
To keep cardinality under control:
- Avoid unbounded labels like
user_id,session_id, oremail - Aggregate or hash high-cardinality identifiers when needed
- Apply sampling before storing metrics with detailed labels
Sampling Strategies
Modern systems create more telemetry than teams can store or analyze. As data grows, queries get slower and storage needs go up. Reducing data is essential in busy environments to avoid overload and slowdowns.
OpenTelemetry addresses this with several sampling strategies, each with trade‑offs:
| Strategy | Decision Point | Strength | Limitation | Best Used For |
|---|---|---|---|---|
| Head Sampling | At request start | Low overhead | May drop important traces | High-volume services |
| Tail Sampling | After request completes | Keeps meaningful traces | Requires buffering and resources | Error analysis |
| Probabilistic | Random selection | Predictable data volume | Can miss rare events | Cost control |
| Adaptive | Based on conditions | Captures high-value cases | More complex to configure | Production tuning |
Smart edge filtering cuts down on noise by changing sampling rates based on errors or traffic. Most teams use a mix of strategies to keep costs down while staying visible.
Example policy:
- Retain 100% of error traces (status ≥ 400)
- Capture 100% of slow requests (>1s)
- Sample 10% of regular successful requests
- Record 1% of health checks
This approach keeps important insights while controlling the amount of telemetry and keeping costs manageable.
Context Propagation
Context propagation keeps traces connected as requests move through multiple services. When a service receives a request, it also receives trace metadata. The service uses this metadata to create a span linked to the trace, which reveals the full request path.
OpenTelemetry applies the W3C Trace Context standard to handle this across platforms and protocols. Trace context is passed in HTTP headers, and optional baggage can include details such as region or tenant ID.
Example HTTP headers:
traceparent: 00-4bf92f3577b34da6a3ce929d0e0e4736-00f067aa0ba902b7-01
tracestate: vendor1=value1,vendor2=value2
Where:
00– Version4bf92f3577b34da6a3ce929d0e0e4736– Trace ID for the full request00f067aa0ba902b7– Parent Span ID linking to the previous hop01– Sampling flag showing if the trace is recorded
With trace context flowing between services, spans automatically join into a complete distributed trace without manual correlation.
Signal-to-Noise Ratio
Alert fatigue happens when too many low-value alerts make teams miss real problems. About 38% of teams say a poor signal-to-noise ratio is their biggest challenge for quick incident response.
The goal is to only surface alerts that matter for service impact. To improve the signal‑to‑noise ratio, focus on actionable alerts:
- Alert on Service Level Objectives (SLOs), not thresholds: “Error budget 50% consumed” is meaningful, while “CPU > 80%” is noise.
- Group related alerts into a single incident.
- Route alerts smartly to the right team with context.
- Attach runbooks so responders know the next step.
- Prune regularly to remove alerts that never drive action.
Example: Reducing Noise
| Before (Noisy) | After (Signal) |
|---|---|
| CPU > 80% on host‑17 | checkout‑service SLO breached: 99.2% → 97.8% |
| Memory > 75% on host‑23 | Error budget 80% consumed in 2 hours |
| Disk > 90% on host‑41 | Probable cause: Database connection pool exhausted |
| Network errors on host‑12 | Runbook: scale‑database‑connections.md |
| 50+ alerts per hour, team ignores them | 1 actionable alert with clear cause and next step |
Building Your Observability Stack
Building an observability stack isn’t just about connecting tools — it’s about creating a flexible architecture that scales as your systems evolve. With a strong foundation, teams can collect, process, and act on telemetry data without constantly reworking their setup.
This section breaks down the core components of a modern observability stack and how to design them for long-term adaptability.
OpenTelemetry: The Industry Standard
OpenTelemetry (OTel) is the standard for unified logging, metrics, and tracing. Teams use OTel to instrument distributed systems without vendor lock‑in, gaining consistent telemetry across major languages, such as Java, Python, and Node.js.
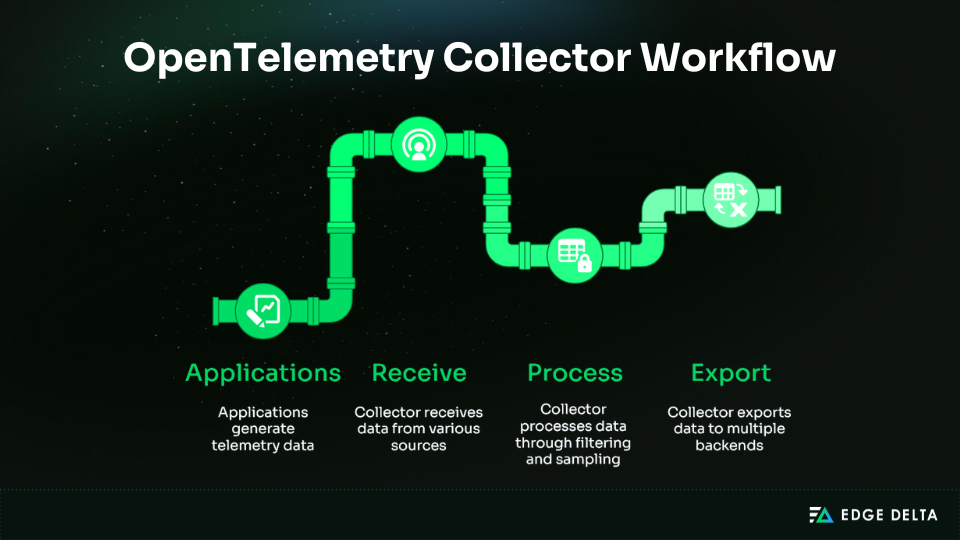
OTel provides APIs and SDKs with auto‑instrumentation for fast setup, along with manual options for deeper visibility. The OpenTelemetry Collector acts as a central pipeline, receiving, processing, and exporting telemetry to one or multiple backends.
To ensure consistency, OTel defines semantic conventions, such as service.name, http.status_code, and db.system. This shared vocabulary makes telemetry meaningful across tools, simplifies correlation, and reduces noise.
| Component | Purpose |
|---|---|
| APIs and SDKs | Capture telemetry from multiple languages and frameworks |
| Auto and Manual Instrumentation | Enable quick setup or deeper span control |
| OpenTelemetry Collector | Process and route telemetry before storage or visualization |
| Semantic Conventions | Standardize attribute naming for easier correlation |
Teams adopt OTel to unify signals, avoid lock‑in, and scale observability with community support. Most begin with auto‑instrumentation, then add custom spans for deeper tracing.
Open-Source Observability Components
Many teams build their observability stack using open-source tools to stay flexible, avoid lock-in, and integrate deeply with their infrastructure. Adoption has skyrocketed, with 75% of organizations now using open-source observability components and 70% combining them with managed services in hybrid setups.
Among the open-source platforms, Prometheus remains the most deployed metrics system in production, used by 67% of teams.
Common tools and their roles:
| Tool | Purpose | Best For |
|---|---|---|
| Prometheus | Pull-based metrics, PromQL, Alertmanager | Kubernetes and microservices |
| Grafana | Dashboards and alerting across sources | Unified visualization |
| Loki | Log aggregation with label-based search | Centralized logging |
| Tempo/Jaeger | Distributed tracing backends | Service analysis |
| Mimir | Long-term metric storage for Prometheus | Historical performance |
By combining these components, teams gain a flexible, scalable, and cost‑efficient observability stack. Open standards provide the backbone, while edge processing keeps data actionable without overwhelming budgets or backends.
Deployment Patterns and Architecture
How telemetry is collected and routed has a direct impact on performance, cost, and scalability. OpenTelemetry supports multiple deployment patterns, allowing teams to choose based on infrastructure maturity, data volume, and processing needs.
There are three common architectures for collector deployment:
| Pattern | Architecture Flow | Pros | Cons |
|---|---|---|---|
| Agent per Host | App → Local OTel Agent → Backend | Low latency, simple setup | No centralized processing or filtering |
| Gateway Pattern | Apps → Local Agent → Central Gateway Collector → Backend | Centralized control, routing, filtering | Adds a network hop |
| Distributed / Edge Processing | Apps → Edge Processor → Central Aggregation → Backend | Reduces data egress, enables early sampling and filtering | Higher setup complexity |
Edge collectors handle telemetry close to where it’s created, either on nodes or in regions. This makes systems more scalable and less dependent on central backends. Tools like Edge Delta use this approach, filtering and reducing data before it leaves the source.
This provides several advantages:
- Cuts network bandwidth by up to 70%–90%.
- Enables intelligent sampling at the node or region.
- Lowers backend storage costs through early aggregation.
- Speeds up queries with pre‑processed data.
- Supports compliance by keeping sensitive data local.
The ideal setup varies based on your scale. Small teams may employ agents per host, but larger setups rely on gateway or edge aggregation for higher efficiency and management.
Implementing Observability: Step-by-Step Guide
You can’t get effective observability through tooling alone. It is a step-by-step deployment that aligns with your system’s objectives. Here is an explanation of a phased strategy for creating observability that is production-ready, including planning, instrumentation, pipelines, and alert development.
Phase 1: Planning Your Observability Strategy
Start by looking at where you are now. Check your monitoring tools, common problems, and any missing data from past incidents. This helps you find gaps in observability and avoid repeating the same mistakes.
Next, set clear goals for success. Decide what questions your system should answer, choose an acceptable MTTR, and set reliability targets that focus on user impact instead of just uptime numbers.
After setting your priorities, pick an architecture that fits your environment. Use this decision guide:
- High data volume → distributed or edge processing
- Compliance needs → local edge filtering
- Cost constraints → sampling and aggregation
- Existing systems → extend, not replace
Phase 2: Instrumenting Your Applications
Instrumentation converts your application’s behavior into telemetry signals. Always initialize OpenTelemetry before loading other libraries — setting it up afterward can cause you to miss critical spans from HTTP clients, database calls, and other dependencies.
There are two main approaches:
- Auto-instrumentation for fast setup when no custom business metrics are needed.
- Hybrid (auto + manual spans) when deeper business-level insights are required.
Auto-instrumentation collects telemetry for common operations like HTTP calls, database queries, and messaging. It’s the fastest way to get visibility into your system.
Example: Auto-Instrumentation (Node.js)
// tracing.js - Initialize BEFORE app imports
const { NodeSDK } = require('@opentelemetry/sdk-node');
const { getNodeAutoInstrumentations } =
require('@opentelemetry/auto-instrumentations-node');
const { OTLPTraceExporter } =
require('@opentelemetry/exporter-trace-otlp-http');
const { Resource } = require('@opentelemetry/resources');
const { SemanticResourceAttributes } =
require('@opentelemetry/semantic-conventions');

const sdk = new NodeSDK({
  traceExporter: new OTLPTraceExporter({
    url: 'http://otel-collector:4318/v1/traces',
  }),
  instrumentations: [getNodeAutoInstrumentations()],
  resource: new Resource({
    [SemanticResourceAttributes.SERVICE_NAME]: 'checkout-service',
  }),
});

sdk.start();
Example: Manual Span (Python)
from opentelemetry import trace
from opentelemetry.trace import Status, StatusCode

tracer = trace.get_tracer(__name__)

def process_payment(order_id, amount):
    with tracer.start_as_current_span("process_payment") as span:
        span.set_attribute("order.id", order_id)
        span.set_attribute("payment.amount", amount)
        try:
            result = payment_gateway.charge(amount)
            span.set_attribute("payment.status", "success")
            return result
        except PaymentError as e:
            span.set_status(Status(StatusCode.ERROR))
            span.record_exception(e)
            raise
To maintain consistency and avoid telemetry inflation, follow these recommended practices:
| Do’s | Don’ts |
|---|---|
| Use semantic conventions | Log sensitive data as attributes |
| Add context such as user_id or request_id | Create spans for every function |
| Instrument service boundaries first | Introduce unbounded cardinality |
| Record exceptions with spans | Skip trace context propagation |
Phase 3: Deploying the Collector Pipeline
After your apps are instrumented, you need to manage telemetry before it goes to storage or dashboards. The OpenTelemetry Collector handles this step by receiving data, processing it, and sending it to one or more backends.
A well-tuned collector makes your system more stable and cost-effective:
- Batching reduces export overhead.
- Filtering removes unnecessary data.
- Memory limits prevent resource spikes.
The configuration below shows how receivers, processors, and exporters form pipelines that control telemetry flow and reduce downstream load.
receivers:
  otlp:
    protocols:
      grpc:
      http:

processors:
  batch:
    timeout: 10s
    send_batch_size: 1024

    memory_limiter:
    check_interval: 1s
    limit_mib: 512

    filter:
    traces:
      span:
        - attributes["http.target"] == "/health"

exporters:
  prometheus:
    endpoint: "0.0.0.0:8889"

    otlp:    endpoint: "your-backend:4317"
    tls:
      insecure: false

service:
  pipelines:
    traces:
      receivers: [otlp]
      processors: [memory_limiter, batch, filter]
      exporters: [otlp]

        metrics:
      receivers: [otlp]
      processors: [memory_limiter, batch]
      exporters: [prometheus]
Phase 4: Building Dashboards and Alerts
Dashboards should give useful information without being overwhelming. If you put all telemetry into a single view, important signals can get lost in the clutter. Organize dashboards by purpose so teams can focus on what matters when they need it.
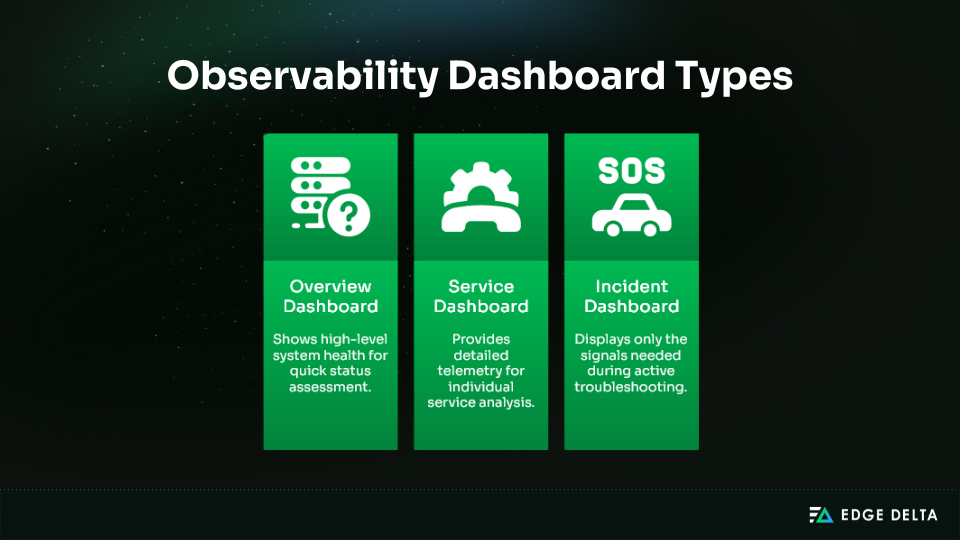
No matter the dashboard type, the most valuable insights come from the Golden Signals: latency, traffic, errors, and saturation. These show user impact better than basic infrastructure metrics and help spot issues early.
Alerts should bring further clarity. Instead of relying on averages that hide spikes, use percentiles and error budgets to capture meaningful change. An effective alert is immediately understandable and actionable, answering four key questions without extra analysis:
- What broke?
- Why does it matter?
- What to do?
- Who responds?
In summary, dashboards help teams stay aware, while alerts prompt action. When both are designed thoughtfully, teams can respond faster and avoid getting overwhelmed by too much information.
Overcoming Common Observability Challenges
Distributed systems flood teams with telemetry, driving up costs and obscuring insight. Fragmented tools weaken visibility, noisy alerts delay response, and multi‑cloud setups add friction. Without a strategy, observability becomes a burden.
This section outlines these recurring challenges and presents practical strategies to control data, unify tooling, reduce noise, and simplify operations.
Challenge 1: Data Volume and Cost Explosion
As the distributed system scales, every service begins emitting logs, metrics, and traces for every request. Many teams ingest this data without filtering, leading to rising storage costs, slower queries, and unclear retention controls.
More than half of engineering teams now see cost as a big observability concern. This means controlling data should be a key strategy, not just a way to optimize. To regain control without losing visibility, teams apply three high-impact strategies:
| Strategy | Description | Impact |
|---|---|---|
| Intelligent Sampling | Capture 100% of errors/slow requests; sample routine events | Cuts trace storage by ~70%–90% (depends on rate) |
| Edge Processing | Filter/aggregate telemetry before export | Reduces data egress by ~70%+ |
| Tiered Retention | Hot (7d), warm (30d), cold (90d+) storage tiers | Lowers storage costs by ~80%–90% |
Challenge 2: Tool Sprawl and Integration Complexity
Observability stacks often grow reactively, leaving separate tools for logs, metrics, and traces. Each adds its own agent and query language, creating overhead and slowing investigations.
- Before – Tool Sprawl: Disconnected tools, multiple agents, fragmented dashboards, no signal correlation
- After – Unified Pipeline: OpenTelemetry-based, single collector, shared trace IDs, consistent queries
The solution starts by standardizing on OpenTelemetry, combining pipelines, and adding standard identifiers to signals.
| Strategy | Description | Impact |
|---|---|---|
| Standardize on OpenTelemetry | One library, vendor‑neutral format | Backend flexibility without rework |
| Unified Pipelines | Replace multiple agents with one collector | Single query surface, full correlation |
| Cross‑Pillar Correlation | Embed trace IDs across logs, metrics, traces | Faster investigation with end‑to‑end context |
Challenge 3: Alert Fatigue and Noise
Teams often get overwhelmed by alerts based on simple thresholds, like CPU spikes, memory warnings, or minor errors. Too many alerts create noise, which makes engineers trust the system less and more likely to miss real problems.
Alert fatigue is a major reason for slow incident response, with 38% of teams saying noise is a big challenge. To make sure alerts lead to action, teams use structured alerting practices:
| Strategy | Description | Impact |
|---|---|---|
| SLO‑Based Alerting | Alert on error budgets, SLO breaches, and burn rates instead of raw thresholds | Alerts tied to user experience |
| Alert Prioritization | Classify alerts: P0 (outage), P1 (degradation), P2 (capacity), P3 (informational) | Clear urgency, reduced noise |
| Context + Runbooks | Include impact, symptoms, runbook, and dashboard link in every alert | Faster triage and resolution |
An SRE Teammate addresses alert fatigue directly by investigating incoming alerts autonomously, correlating signals across services, and escalating only the ones that require human attention.
Challenge 4: Multi-Cloud and Hybrid Complexity
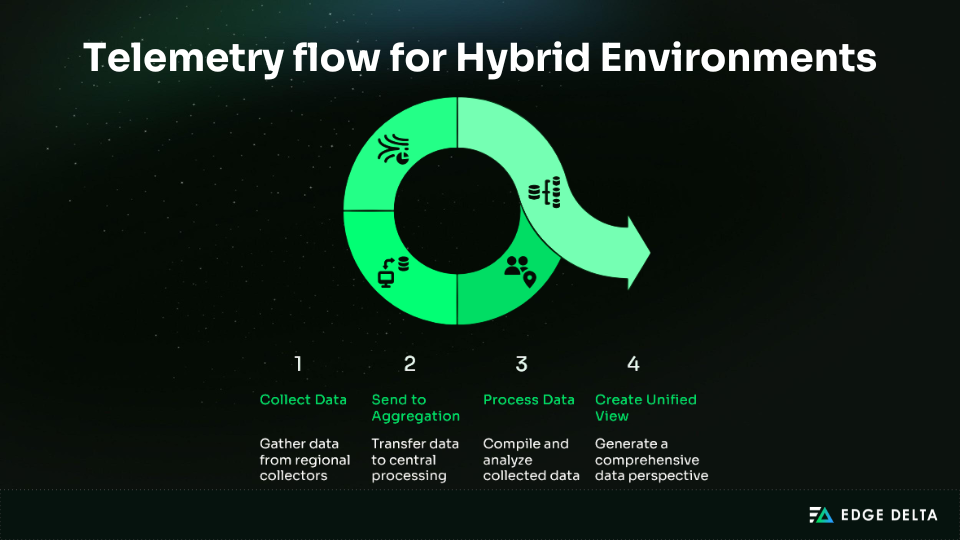
Using AWS, Azure, GCP, and on-prem environments splits up tools and data formats. Each platform only gives part of the picture, so teams have to piece together separate views, which slows down troubleshooting.
If instrumentation isn’t consistent, observability becomes siloed and hard to use, making it tough to get a full view of system health. To fix this, teams standardize and organize how they collect data:
| Step | Implementation | Outcome |
|---|---|---|
| Cloud-Agnostic Instrumentation | Use OpenTelemetry across all environments | Consistent data format and vendor flexibility. |
| Distributed Collection, Central View | Regional collectors feed a central layer | Unified visibility across multi-cloud apps. |
Advanced Observability Practices
After setting up basic observability, the next step is to go beyond just dashboards and metrics. Experienced teams focus on connecting observability to business reliability goals and managing configurations like code.
This section looks at advanced techniques like SLO-driven operations and observability-as-code, helping teams build a consistent, scalable, and reliable practice.
Service Level Objectives (SLOs) and Error Budgets
In Site Reliability Engineering (SRE), observability matters most when it’s linked to business reliability goals. Metrics alone aren’t useful unless they show how reliable the system needs to be.
This is why every mature observability practice relies on the SLI → SLO → SLA hierarchy.
-
SLI (Service Level Indicator) – What you measure.
Example: “99.95% of API requests completed under 500ms in the last 30 days.”
-
SLO (Service Level Objective) – The reliability target.
Example: “99.9% availability, allowing 43.8 minutes of downtime per month.”
-
SLA (Service Level Agreement) – The contractual promise.
Example: “99.9% uptime or a 10% monthly credit.”
If teams don’t set SLIs and SLOs, they have no clear way to know if the system is healthy or giving users a good experience.
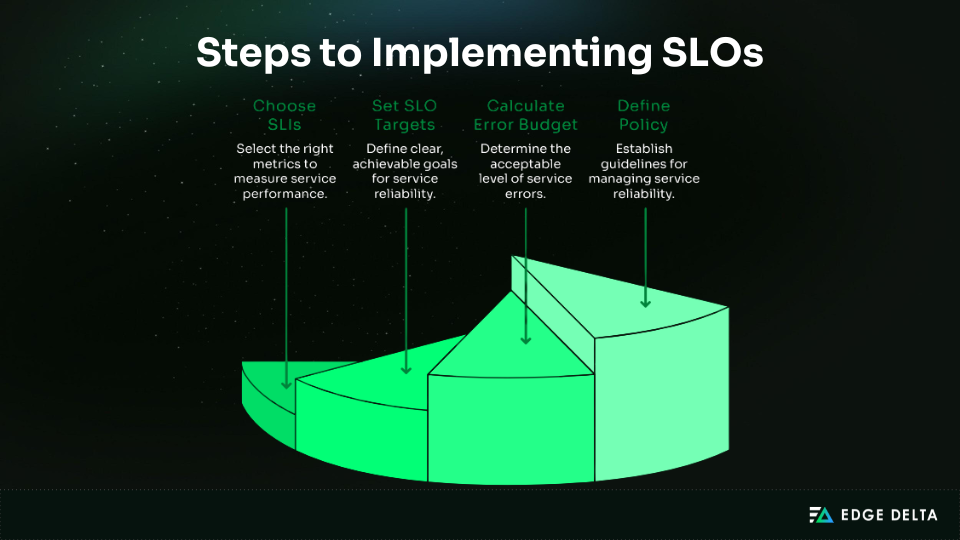
To put these concepts into practice, teams can follow a step‑by‑step process for implementing SLOs and managing error budgets.
- Choose SLIs – Measure key signals like availability, latency, quality, and throughput.
- Set SLOs – Define realistic reliability thresholds.
- Calculate Error Budget – Translate SLOs into allowable downtime or errors.
- Define Policy – Adjust release pace based on remaining budget.
Observability as Code
Experienced teams don’t rely on manual dashboard changes or tweaking alerts in the UI. They use infrastructure-as-code for observability, so dashboards, alerts, and configs are version-controlled, reviewed, and deployed automatically.
To operationalize this approach, observability components are treated as managed assets rather than one-off configurations. Each change follows the same governance model used for application code.
| Practice | Outcome |
|---|---|
| Store configs in Git | Full traceability and rollback capability |
| Use pull requests for changes | Peer-reviewed alerts and dashboards |
| Deploy via CI/CD | Consistent rollout across environments |
| Treat configs as infrastructure code | Repeatable and testable observability setup |
A typical repository structure:
observability/
 ├── dashboards/
 │   ├── overview.json
 │   └── service-health.json
 ├── alerts/
 │   ├── slo-violations.yaml
 │   └── capacity.yaml
 └── collectors/
    └── otel-config.yaml
Deployment flow example: git push → Validate → Test → Deploy to prod
This approach stops configuration drift, keeps noisy alerts out of production, and allows quick recovery by using version-controlled observability assets.
Real-World Implementation: E-Commerce Example
To show how observability works in practice, let’s apply these ideas to a microservices e-commerce platform.
This walkthrough covers instrumentation, data collection, and cross-service investigation to show how telemetry can speed up problem-solving in a real-world setup.
Scenario: Microservices Platform
The e-commerce platform runs on a microservices architecture where every user request flows through an API Gateway before reaching backend services responsible for different business functions.
User → API Gateway → [Services]
                     ├─ Product Service (Node.js)
                     ├─ Checkout Service (Python)
                     ├─ Payment Service (Go)
                     └─ Inventory Service (Java)
Behind these services sit supporting components that handle data, caching, and asynchronous processing:
- PostgreSQL for transactional data
- Redis as a low-latency cache
- RabbitMQ for message queuing
- Kubernetes (AWS EKS) for deployment and scaling
Monitoring shows no errors, and logs confirm that requests are successful, yet users still experience slow checkout times with no obvious failure signals. Traditional logs reveal nothing about the cause, making this a strong case for distributed tracing and metric correlation.
Implementation Walkthrough
To resolve the checkout latency issue, observability must be applied across the stack. The following steps show how telemetry is captured, processed, and analyzed using the three pillars (metrics, traces, and logs) to pinpoint where latency originates inside the request flow.
Step 1: Instrument with OpenTelemetry
Start by enabling distributed tracing across services with OpenTelemetry. Auto‑instrumentation captures HTTP calls, database queries, and message-queue operations without custom logic, providing quick visibility with minimal effort.
Product Service (Node.js):
const { NodeSDK } = require('@opentelemetry/sdk-node');
const { getNodeAutoInstrumentations } =
require('@opentelemetry/auto-instrumentations-node');

const sdk = new NodeSDK({
  serviceName: 'product-service',
  instrumentations: [getNodeAutoInstrumentations()],
});
sdk.start();
Checkout Service (Python):
from opentelemetry.instrumentation.flask import FlaskInstrumentor
from opentelemetry.instrumentation.sqlalchemy import
 SQLAlchemyInstrumentor

FlaskInstrumentor().instrument_app(app)
SQLAlchemyInstrumentor().instrument(engine=db.engine)
Once enabled, every request produces trace spans across services, capturing HTTP calls, database queries, and messaging operations for end‑to‑end visibility.
Step 2: Deploy Observability Stack
With instrumentation in place, the next step is to collect and route telemetry. The OpenTelemetry Collector is deployed as a DaemonSet in Kubernetes, so each node runs a lightweight agent that receives traces and metrics from the services.
# OTel Collector as DaemonSet
apiVersion: apps/v1
kind: DaemonSet
metadata:
  name: otel-collector
spec:
  template:
    spec:
      containers:
      - name: otel-collector
        image: otel/opentelemetry-collector-contrib:latest
This deployment allows telemetry to be processed locally before forwarding to a backend. It also enables future enhancements such as edge filtering, sampling, or routing traces based on service or region context.
Step 3: Investigate with the Three Pillars
After instrumentation and collection are in place, the next task is to investigate performance issues using metrics, traces, and logs together.
- Metrics surface the symptom.
checkout_p99_latencyspikes to 3.2s compared to the 500ms baseline, confirming user impact but not the cause. - Traces reveal the flow. Trace ID
abc123shows the request path:
API Gateway (50ms)
└─ Checkout Service (2800ms) ← Delay
└─ PostgreSQL Query (2400ms) ← Bottleneck- Logs confirm the details. Once the slow span is identified, logs tied to the same trace ID expose the details:
{
  "trace_id": "abc123",
  "message": "Slow query detected",
  "duration_ms": 2400,
  "rows_scanned": 1500000
}
The trace and logs confirm that PostgreSQL is scanning 1.5 million rows due to a missing index. Applying:
CREATE INDEX idx_orders_user_id ON orders(user_id);The fix reduces p99 latency from 3.2s to 450ms, an 85% improvement. Metrics highlighted the symptom, tracing isolated the service, and logs confirmed the root cause in minutes instead of hours.
Best Practices for Production Observability
The next challenge after the observability deployment is operating it effectively in production. Mature teams go beyond tool installation and focus on disciplined practices that improve signal quality, reduce noise, and drive faster incident resolution.
The following best practices offer prescriptive guidance to keep observability sustainable, focused, and aligned with real-world reliability goals.
Instrumentation Best Practices
Effective observability comes from deliberate instrumentation, not volume. Capture only the signals that reveal real behavior in production and help pinpoint reliability issues quickly.
1. Start with Questions, Not Tools
Instrumentation should serve a clear purpose. Define what you need visibility into, such as user experience, latency points,* *failure conditions, and SLO compliance. These questions guide which instruments to use, rather than collecting everything by default.
2. Instrument at Service Boundaries
The most valuable signals appear where systems interact. Prioritize instrumentation at:
- HTTP or gRPC endpoints
- Database query execution
- Message queue interactions
- External API calls
These points reveal performance issues faster than looking deep inside the system.
3. Use Semantic Conventions
Consistency makes telemetry useful. Use OpenTelemetry fields to keep logs, traces, and metrics aligned across services. Common examples are as follows:
http.methodhttp.status_codedb.statementMessaging.system
4. Process Data Intelligently
Avoid shipping raw telemetry unfiltered. Filter noise at the source, aggregate and sample wisely, and process locally to reduce egress and secure data.
5. Focus on Actionable Alerts
Alerts should drive decisions, not anxiety. Each alert must clearly state the symptom and business impact, and provide a link to a runbook or dashboard. Without an action context, an alert becomes noise instead of guidance.
Common Pitfalls to Avoid
Even with good tools, observability can fail if not done well. Mistakes often create noise, raise costs, and make telemetry less useful. Here are common pitfalls and better practices from reliable teams.
| Pitfall | What to Avoid | Recommended Approach |
|---|---|---|
| Over-Instrumenting | Creating spans for every function, adding noise | Instrument only at service boundaries, external calls, and key business operations |
| Ignoring Cardinality | Tagging metrics with unique values like email or user ID | Use controlled dimensions such as user tier, region, or service class |
| No Retention Strategy | Keeping all telemetry at full resolution indefinitely | Apply tiered retention: 7 days full fidelity, 30 days aggregated, 90+ days SLI-only |
| Alerting on Everything | Triggering alerts for every threshold breach | Limit to 2–3 SLO-based alerts per service with severity levels and runbooks |
Frequently Asked Questions
What’s the difference between monitoring and observability?
Monitoring answers “what’s wrong?” It uses predefined metrics and thresholds to alert teams when known issues occur — effective for predictable failures.
Observability, in contrast, answers “why is it wrong?” Rather than relying on static dashboards, it empowers engineers to explore telemetry data in real time and investigate issues that weren’t anticipated during setup.
In essence, monitoring detects the known, while observability explains the unknown — monitoring signals a problem; observability reveals its cause.
How do I choose observability tools for my organization?
Choosing observability tools should reflect your team’s maturity rather than a checklist of features. Start by assessing your internal skills and how much ownership your engineers can realistically take on.
Teams with strong DevOps or SRE expertise often prefer open-source tools that support OpenTelemetry. This avoids vendor lock‑in and supports customization, though it requires significant engineering effort to maintain.
Commercial platforms suit teams seeking faster deployment, managed infrastructure, and built‑in features such as anomaly detection or AI‑driven insights. They reduce maintenance overhead but create vendor dependency.
Many organizations choose a hybrid model. They use OpenTelemetry for portable instrumentation, start with open-source backends to manage costs, and add commercial options as they scale. Focusing on distributed data processing can further cut expenses by up to 90%.
How do I implement observability without disrupting production?
Start small and expand safely. Deploy your observability stack in parallel rather than modifying production immediately. Begin with a non‑critical service using auto‑instrumentation to avoid code changes.
Validate data flow and measure performance impact before scaling further. Add two to three services per week, keeping overhead below five percent. Use feature flags to quickly turn off instrumentation if issues arise.
Once things are stable, enable sampling: capture all errors and slow requests, and around ten percent of successful ones. Build dashboards and set up alerts based on real data. Always deploy during low-traffic and maintain rollback plans.
How do I set appropriate SLOs for my services?
Set SLOs based on real performance data and user expectations, not assumptions. Review metrics over 30 to 90 days to establish baselines that reflect how your systems actually perform.
Typical targets include:
- Internal APIs: 99% uptime
- User‑facing services: 99.9% uptime
- Critical systems: 99.99% uptime
From there, calculate the error budget as 1 minus SLO. For example, 99.9% uptime allows roughly 43 minutes of downtime per month. If 75% of that budget is consumed, pause new releases and focus on reliability improvements.
Always start with achievable goals, then refine over time as your systems and teams mature. This ensures SLOs remain both realistic and meaningful.
How do I optimize observability costs?
Controlling observability spend is a top concern, with more than a third of teams citing it as a significant challenge. The most effective strategies combine more brilliant data collection, storage, and processing.
Use intelligent sampling to capture all errors and slow requests but only a small share of successful calls. Reduce cardinality by removing high-volume labels like user_email or session_id while keeping essentials such as service_name or status_code.
Adopt tiered retention: keep full-resolution data briefly, aggregate for the medium term, and store only key metrics long-term. Process and filter data at the edge to lower egress costs and protect sensitive information.
Conclusion
Logs, metrics, and traces form the core of observability. However, collecting them without purpose doesn’t create clarity. Real observability comes from intentional telemetry focused on user experience and reliability.
Successful teams follow a few principles:
- Start with clarity on what needs to be observed before picking tools.
- Use open standards like OpenTelemetry to ensure consistent instrumentation.
- Roll out observability progressively: prove value in one service, then expand.
- Define SLOs to measure reliability objectively.
- Control data volume using sampling, edge processing, and tiered retention.
Adoption trends reflect this maturity. Around ~75% of organizations now use open-source observability tools, and more than half have implemented tracing. Edge processing architectures are reducing costs by up to 90% while preserving data fidelity.
For new teams, begin with one critical service, apply OpenTelemetry, define an SLO, and learn from real telemetry before scaling. For existing systems, focus on standardization, cost control, and shifting from threshold alerts to SLO-driven alerts.
Complexity, noise, and cost will remain the biggest obstacles. Addressing them through disciplined signal design and consistent standards turns observability from a tool choice into an engineering practice. Build systems designed to be understood. For teams that want to close the loop between observability and response, Edge Delta’s SRE Teammate connects telemetry signals to automated incident investigation — so signals don’t just describe what’s wrong, they drive action.
Source List

